Price Action Trading Strategies That Actually Work in Any Market

Introduction
If you’ve spent any time in the trading world, you’ve probably come across countless indicators, strategies, and “systems” that promise consistent profits. Moving averages, RSI, MACD, Bollinger Bands—the list goes on. While these tools can be useful, many traders eventually realize a simple truth: the more cluttered your chart becomes, the harder it is to make clear decisions.
That’s where price action trading comes in.
Price action trading is built on the idea that everything you need to make a trading decision is already reflected in price. Instead of relying heavily on lagging indicators, you learn to read price action, including how price moves, where it reacts, and why those reactions occur.
What makes price action particularly powerful is its universality. It doesn’t matter whether you’re trading forex, stocks, indices, or crypto. Price moves in patterns driven by human psychology—fear, greed, hesitation, and momentum—and those patterns repeat across all markets.
In this guide, we’re going to break down price action trading strategies that actually work, not just in theory, but in real market conditions. More importantly, you’ll learn how to think about the market in a structured way so you can develop a repeatable edge.
What Is Price Action Trading?
At its core, price action trading is the practice of analyzing raw price movement to make trading decisions. There are no complicated formulas or heavily lagging indicators involved. Instead, the focus is on understanding how price behaves over time.
When you look at a chart through the lens of price action, you’re paying attention to a few key things: how price forms highs and lows, how it reacts at certain levels, and how individual candles reflect buying or selling pressure.
For example, a series of higher highs and higher lows suggests that buyers are in control. On the other hand, lower highs and lower lows indicate that sellers are dominating the market. These simple observations form the foundation of market structure, which is one of the most important concepts in trading.
Another key aspect of price action is how price behaves at specific levels. Markets tend to react at certain zones repeatedly—these are what we call support and resistance. When price approaches these areas, traders pay close attention to how it responds. Does it reject sharply? Does it break through with strong momentum? Or does it stall and consolidate?
Candlestick patterns play a huge role in price action. A single candle can tell a story about the battle between buyers and sellers. A long wick rejecting a level suggests that one side attempted to push price further but failed. A strong engulfing candle shows decisive control from one side of the market.
Ultimately, price action trading is about building context. Instead of relying on signals generated by indicators, you learn to interpret what the market is doing in real time.
Why Price Action Works in Any Market
One of the biggest advantages of price action trading is that it works across all markets and timeframes. This isn’t by accident—it’s because price action is rooted in human behavior.
Markets are driven by participants making decisions under uncertainty. Traders react to news, manage risk, chase momentum, and panic during volatility. These behaviors create patterns in price movement, and those patterns tend to repeat.
For example, when price breaks above a key resistance level, many traders view it as a bullish signal and begin buying. Others who were short may close their positions, adding more buying pressure. This creates momentum. Later, when price pulls back to that same level, traders who missed the initial move see it as a second chance to enter. This is how the break-and-retest pattern forms.
These behaviors are not limited to one market. Whether it’s EUR/USD, gold, Apple stock, or Bitcoin, the same psychological forces are at play.
Price action also adapts well to different market conditions. In trending markets, it helps you identify continuation opportunities. In ranging markets, it allows you to trade reversals at key levels. In volatile conditions, it encourages patience and waiting for a clear structure before entering.
Because of this flexibility, price action serves as a framework rather than a rigid system. It gives you the tools to interpret the market instead of forcing the market to fit a predefined set of rules.
Core Concepts You Must Understand First
Before you start applying any strategy, you need a solid understanding of the core principles that drive price action.
Market Structure
Market structure is the backbone of price action trading. It tells you who is in control—buyers or sellers.
In an uptrend, price forms higher highs and higher lows. This indicates that buyers are consistently pushing the market higher, even after temporary pullbacks. In a downtrend, the opposite occurs: price forms lower highs and lower lows, showing that sellers are dominating.
A range, on the other hand, is when price moves sideways between a defined support and resistance level. In this environment, neither buyers nor sellers have clear control.
You’ll also come across terms like Break of Structure (BOS) and Change of Character (CHOCH). A break of structure confirms continuation in the current trend, while a change of character signals a potential shift in direction.
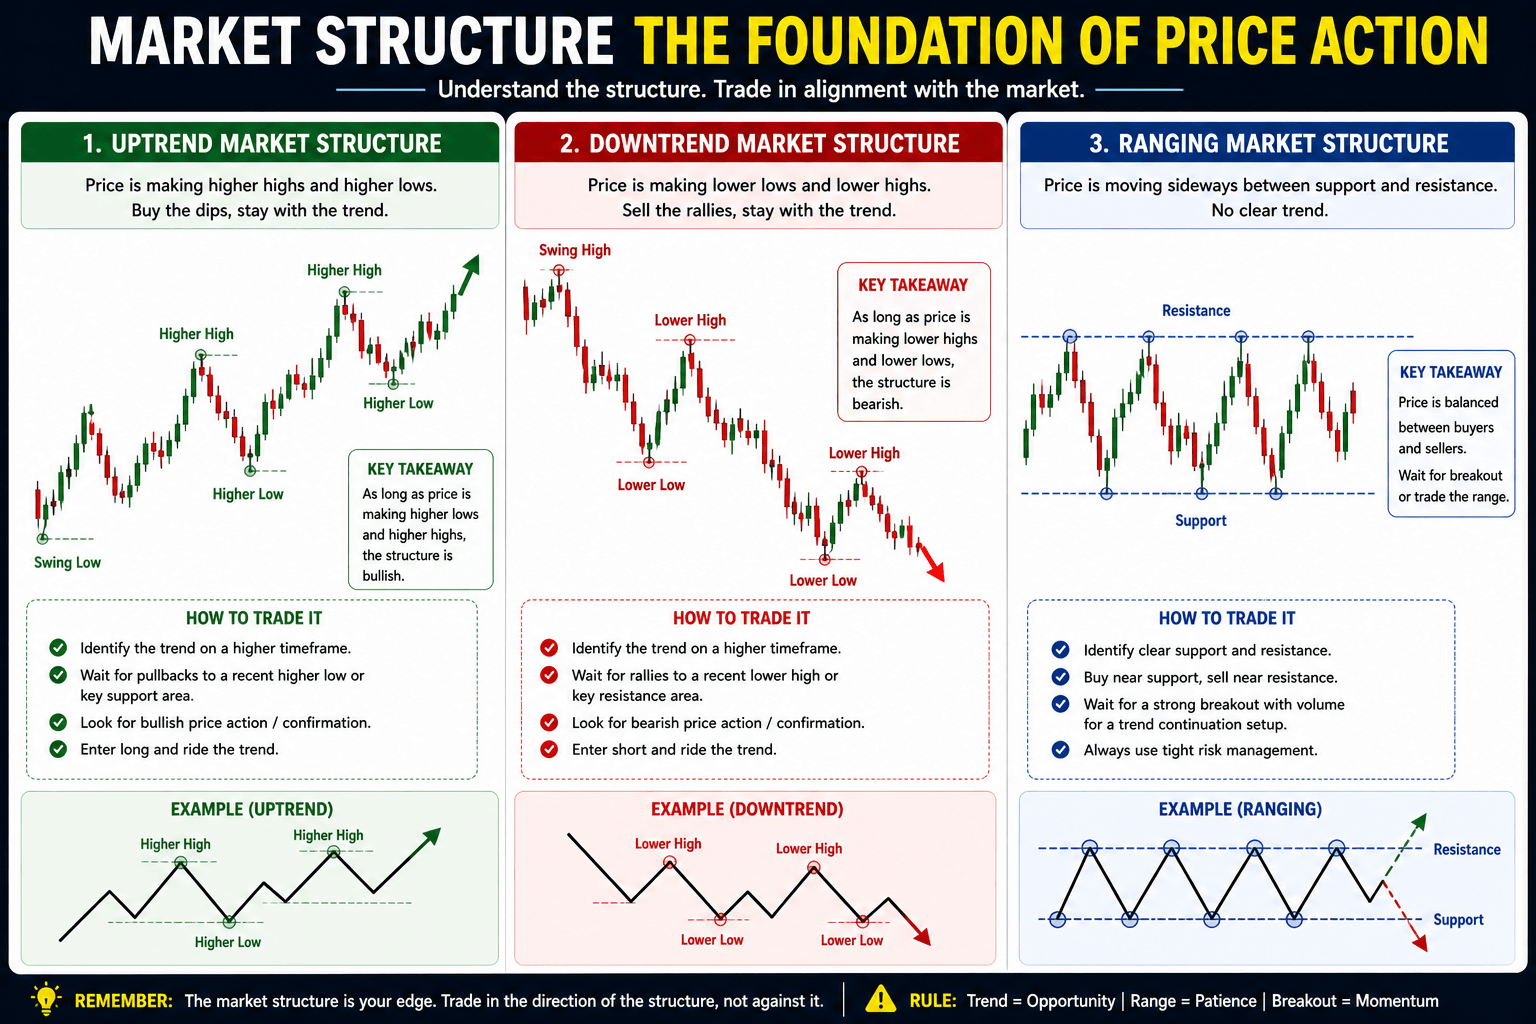
Understanding structure allows you to align your trades with the broader market direction, significantly improving your odds.
Support and Resistance
Support and resistance levels are areas where price has reacted in the past and is likely to react again.
Support is a level where price tends to find buying interest, preventing it from moving lower. Resistance is where selling pressure tends to appear, preventing price from moving higher.
These levels are not exact lines—they are zones. Price may overshoot slightly before reversing, which is why it’s important to think in terms of areas rather than precise points.
One of the most powerful concepts related to these levels is role reversal. When price breaks above resistance, that level often becomes support. Similarly, when price breaks below support, it can turn into resistance.
These levels serve as the “battlefield” where buyers and sellers make decisions, and they form the foundation for many price action trading strategies.
Price Action Trading Strategies That Work
Now that you understand the foundation, let’s explore some of the most effective price action trading strategies.
1. Trend & Pullback Strategy
Markets rarely move in straight lines. Instead, they move in waves—impulse moves followed by pullbacks. The trend and pullback strategy is built around this natural rhythm.
The idea is simple: identify a strong trend, wait for price to pull back, and then enter when the trend resumes.
For example, in an uptrend, you don’t want to buy at the very top of a move. Instead, you wait for price to retrace to a key level, such as a previous support zone or a moving average. Once price shows signs of continuing upward, you enter the trade.
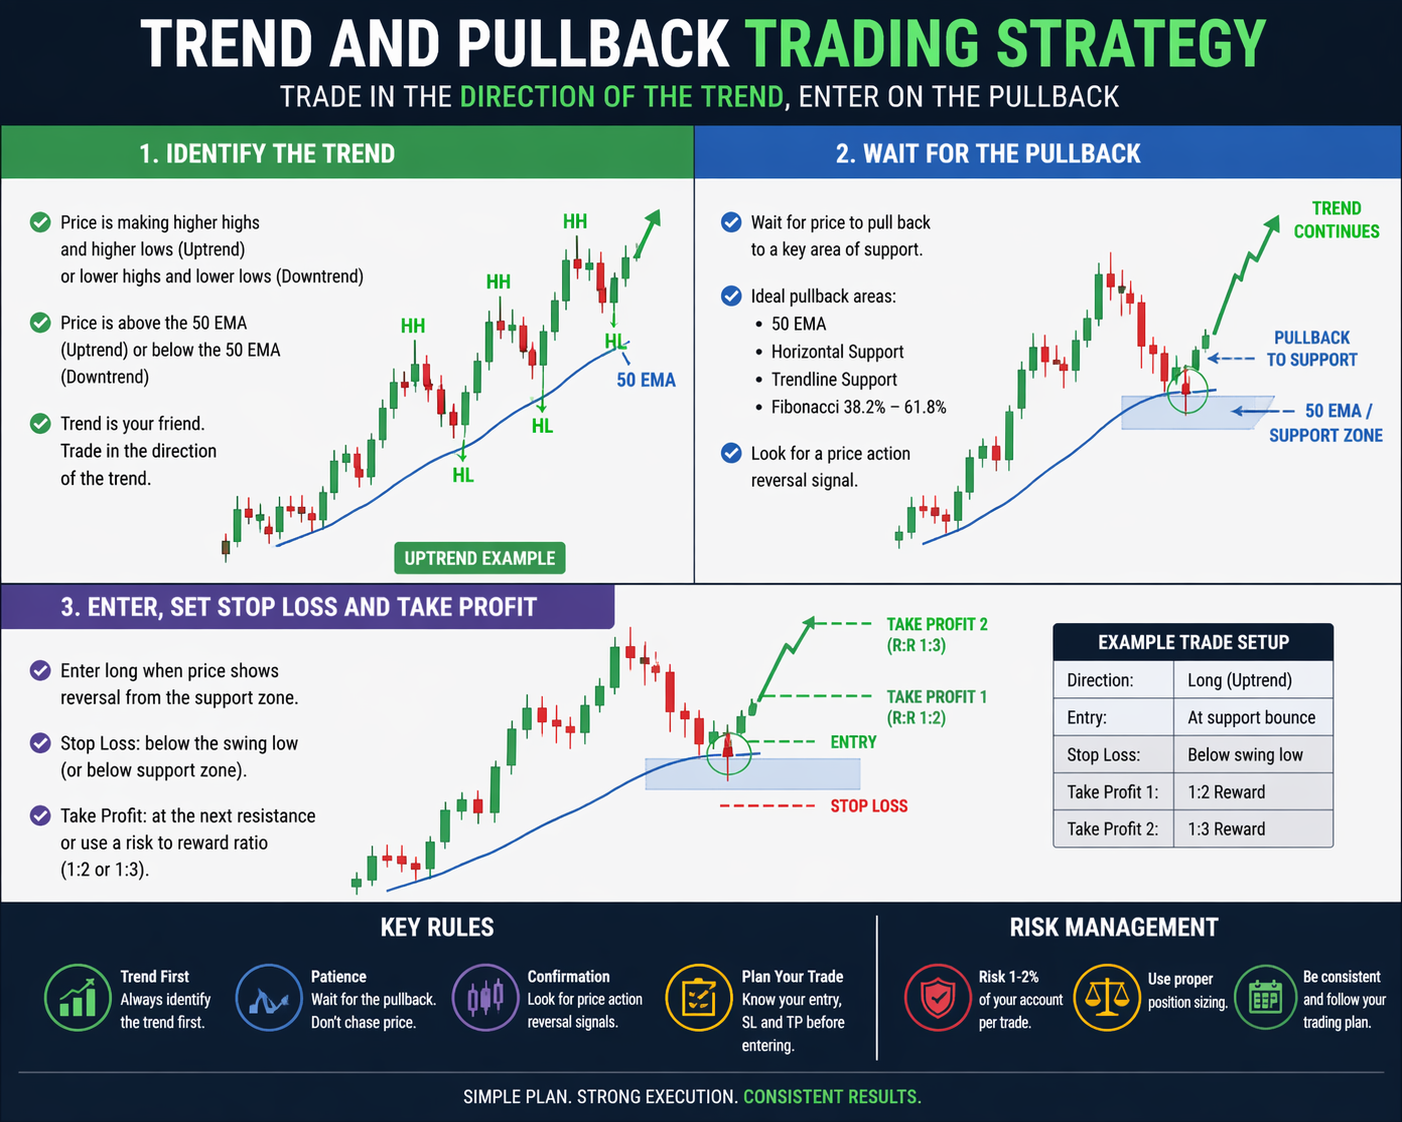
This approach offers a significant advantage: better risk-to-reward. Because you’re entering after a pullback, your stop loss can be placed just below the recent swing low. At the same time, your target can be set at the next high or beyond, giving you a favorable ratio.
This is one of the most reliable strategies because it aligns with the dominant market direction while optimizing your entry.
2. Break and Retest Strategy
The break and retest strategy is a staple of price action trading.
It begins with price breaking a key level, such as support or resistance. However, instead of entering immediately on the breakout—which can often lead to false moves—you wait for price to come back and retest the level.
This retest is crucial. It shows whether the level has truly flipped. If resistance becomes support and holds, it confirms that buyers are in control.
Once price shows confirmation—such as a rejection wick or a strong bullish candle—you enter in the direction of the breakout.
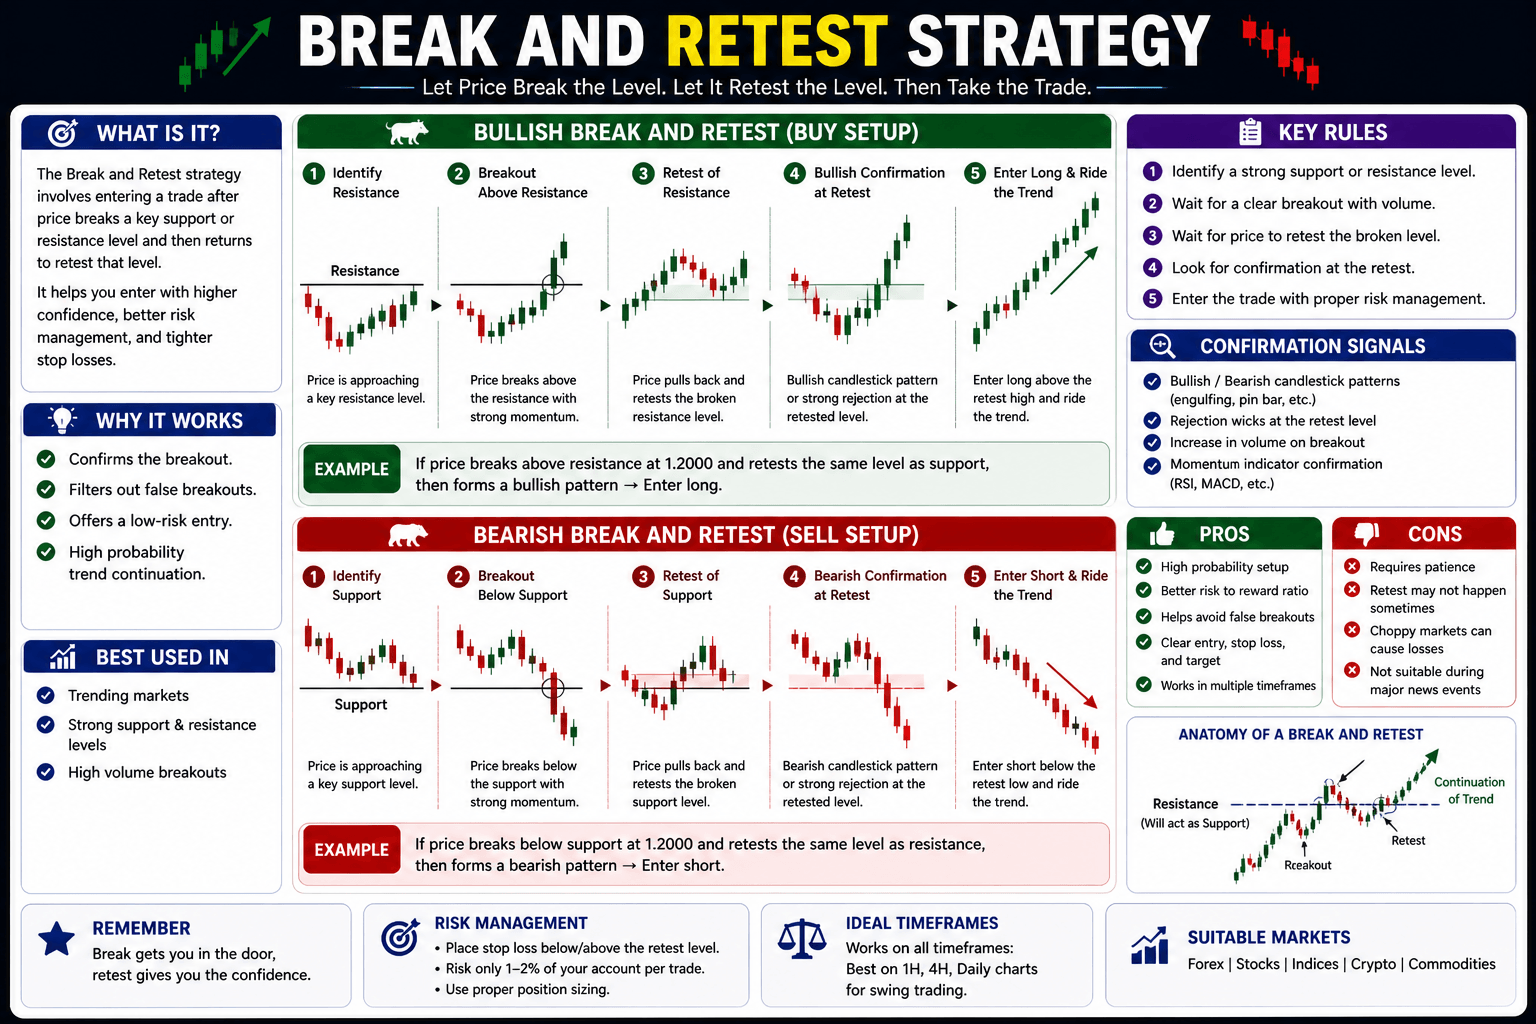
This strategy helps you avoid chasing price and instead enter with more confidence and better timing.
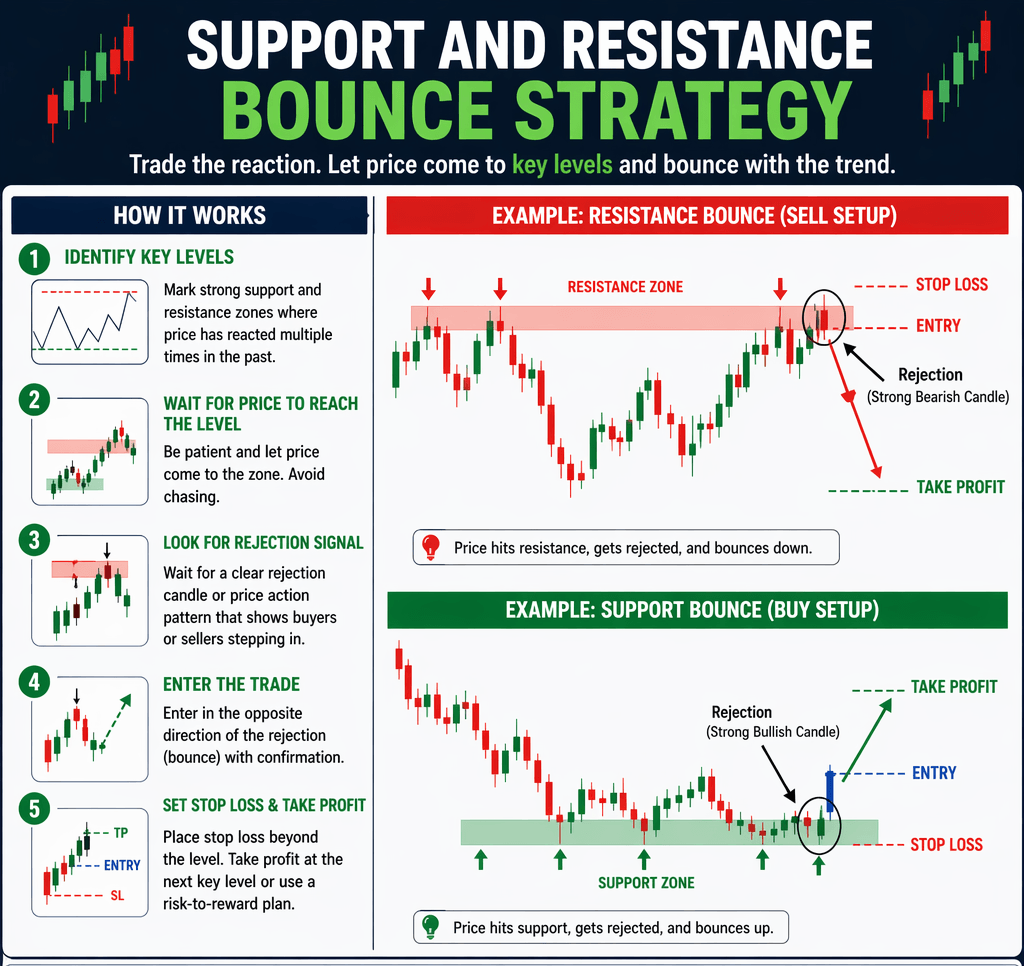
3. Support & Resistance Reversal Strategy
Not all opportunities come from trend continuation. Sometimes, the best trades occur when the market reverses.
The support and resistance reversal strategy focuses on identifying strong levels where price is likely to turn.
When price approaches a well-established resistance level, for example, you look for signs of rejection. This could be a long wick, a bearish engulfing candle, or a failure to break higher. These signals indicate that sellers are stepping in.
You then enter a short trade, targeting a move back toward support.
This strategy works particularly well in ranging markets, where price oscillates between levels. However, it can also be effective at major turning points in trending markets.
4. RSI Mean Reversion Strategy
While price action is often associated with trend-following, there are also opportunities in counter-trend trading.
The RSI mean reversion strategy focuses on identifying when price has moved too far too fast and is likely to pull back.
When RSI shows overbought conditions, it suggests that buying pressure may be exhausted. When it shows oversold conditions, it indicates that selling pressure may be overextended.
However, the key here is not to rely on RSI alone. You combine it with price action—specifically, key levels and confirmation signals.
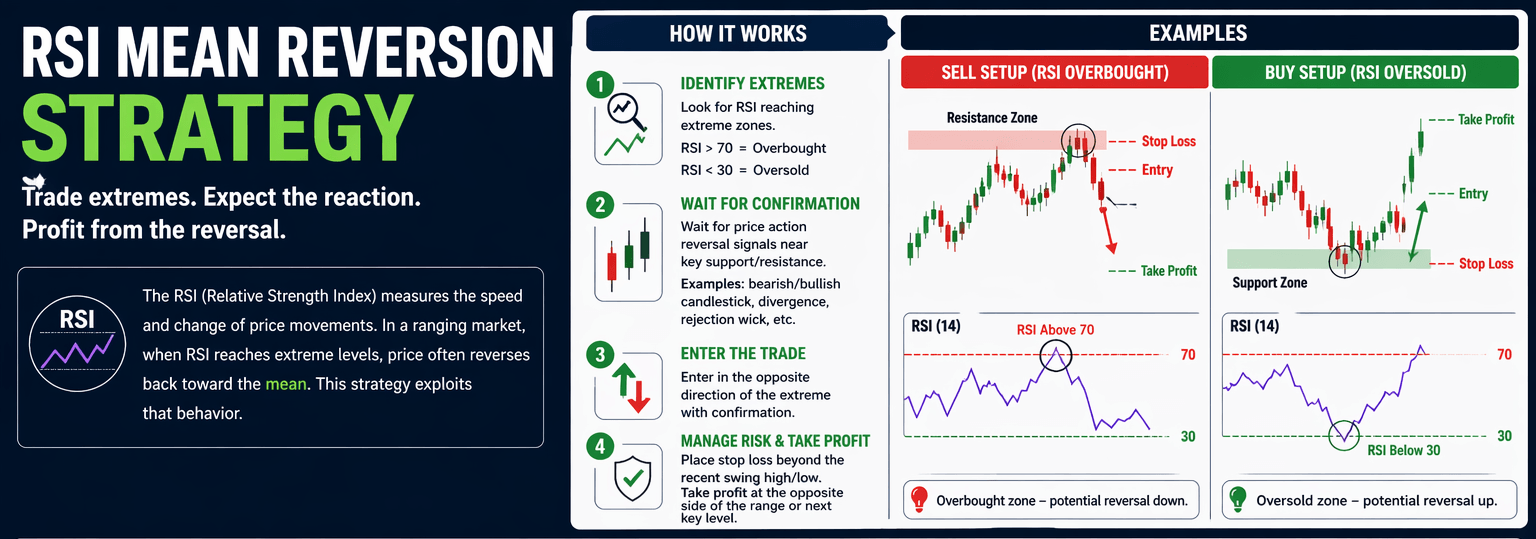
For example, if price is at a major resistance level and the RSI is overbought, you wait for a bearish signal before entering. This increases the probability of a successful reversal.
5. Moving Average Dynamic Support Strategy
Moving averages can be a useful complement to price action when used correctly.
Instead of treating them as signals, think of them as dynamic support and resistance levels.
In a strong trend, price often respects moving averages like the 50-day or 200-day. When price pulls back to these levels, it creates potential entry opportunities.
The key is to wait for confirmation. A simple touch of the moving average is not enough. You want to see price react—ideally, by forming a bullish candle in an uptrend—before entering.
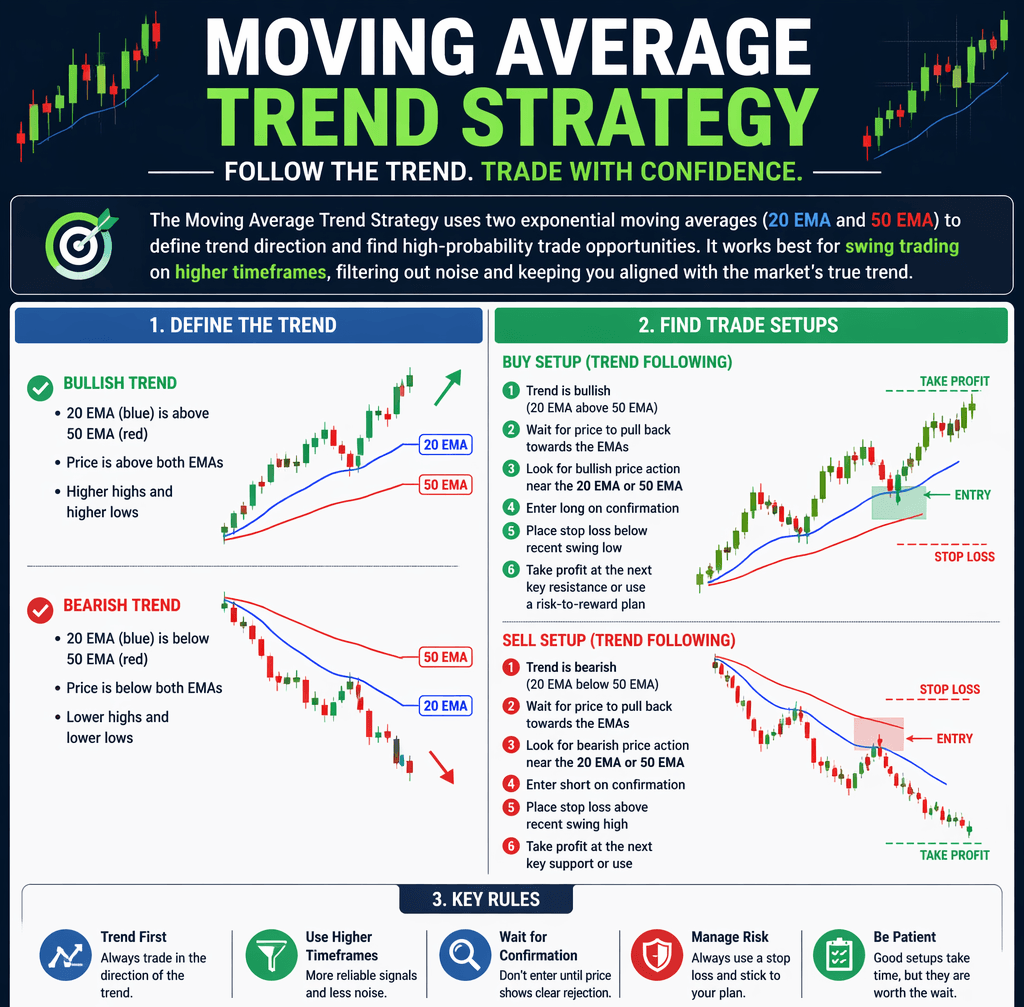
This strategy helps you stay aligned with the trend while using a structured reference point for entries.
How to Confirm Your Entries
One of the biggest mistakes traders make is jumping into trades without confirmation.
Impulsive trading is an enemy of a trader’s account balance.
A level is just a level until price proves it matters.
Confirmation can come in several forms. Candlestick patterns like engulfing candles or pin bars can indicate strong rejection. A break in structure on a lower timeframe can signal a shift in momentum. Confluence—where multiple factors align—adds even more weight to a setup.
For example, a pullback to support combined with a bullish engulfing candle and a higher low is far more powerful than any single signal on its own.
Patience is critical here. Waiting for confirmation may mean missing a few trades, but it dramatically improves the quality of the ones you take.
Risk Management (Your Real Edge)
No strategy will save you if your risk management is poor.
Professional traders focus less on being right and more on managing risk effectively.
This means always defining your stop loss before entering a trade. It also means risking only a small portion of your account on each trade—typically 1% or less.
The goal is to ensure that no single loss can significantly damage your account.
At the same time, you aim for favorable risk-to-reward ratios. If you’re risking 1 unit to make 2 or 3 units, you don’t need to win every trade to be profitable.
This is especially important in swing trading, where larger moves allow for bigger targets relative to your stop loss.
Common Mistakes to Avoid
Even with a solid strategy, certain mistakes can hold you back.
One of the most common is entering trades without confirmation. Another is overtrading—taking setups that don’t meet your criteria simply because you want to be in the market.
Ignoring the broader context is another issue. A strong level in isolation may not hold if the overall trend is pushing against it.
Emotional decision-making, such as moving your stop loss or closing trades prematurely, can also undermine your results.
Recognizing and avoiding these mistakes is just as important as learning the strategies themselves.
How to Build Your Own Price Action System
The key to long-term success is not jumping from one strategy to another, but building a system you can execute consistently.
Start by choosing one or two strategies that resonate with you. Define clear rules for entries, stop losses, and take profits. Backtest your approach to see how it performs over time.
Once you’re confident, stick to your plan. Consistency is what turns a good strategy into a profitable one.
Final Thoughts
Price action trading is not about predicting the market—it’s about understanding it.
By focusing on structure, levels, and behavior, you can develop a clear and disciplined approach to trading. You don’t need dozens of indicators or complex systems. What you need is a solid framework and the patience to follow it.
Master that, and you’ll have a strategy that works in any market.
FAQs: Price Action Trading Strategies
1. What are price action trading strategies?
Price action trading strategies rely on analyzing raw price movement—such as market structure, support and resistance, and candlestick patterns—without heavy reliance on indicators. Traders use these strategies to make decisions based on how price behaves in real time.
2. Do price action trading strategies really work?
Yes, price action trading strategies work because they are based on market behavior and psychology. Since they focus on how buyers and sellers interact, they remain effective across different markets and timeframes when applied with proper risk management.
3. What is the best price action trading strategy for beginners?
The trend and pullback strategy is often considered one of the best price action trading strategies for beginners. It involves trading in the direction of the trend after a temporary retracement, making it easier to follow and manage risk.
4. Can price action trading strategies be used without indicators?
Yes, most price action trading strategies are designed to work without indicators. Traders primarily rely on chart patterns, key levels, and price structure, though some may use indicators such as RSI or moving averages for additional confirmation.
5. Which markets can you trade using price action trading strategies?
Price action trading strategies can be applied to any financial market, including forex, stocks, indices, and cryptocurrencies. Because they are based on price behavior, they are not limited to a specific asset class.
6. What timeframe is best for price action trading strategies?
Price action trading strategies can be used on any timeframe, but higher timeframes, starting from the 4-hour chart, tend to provide more reliable signals due to reduced market noise.
7. How do you confirm entries in price action trading strategies?
Confirmation typically comes from candlestick patterns (such as engulfing candles or pin bars), structure shifts, or strong reactions at key levels. Waiting for confirmation helps improve the probability of a successful trade.
8. Are price action trading strategies suitable for swing trading?
Yes, price action trading strategies are widely used in swing trading because they focus on capturing larger market moves based on structure and key levels, often leading to better risk-to-reward opportunities.