What Is Support and Resistance in Trading? A Practical Guide
You keep getting chopped up in the market. You buy when a stock looks strong, only to watch it immediately reverse and hit your stop loss. It has happened to every one of us.
Here is the reality: you are trading blindly without a map. Most of us start out basing our entries on gut feelings rather than on structural price levels. We let fear and greed run the show. We chase green candles and panic-sell the red ones.
The market actually has a hidden architecture. It moves from one zone to another, bouncing between invisible floors and ceilings. Once you understand what support and resistance in trading really is, you stop guessing. You start treating the market like a professional.
In this guide, we are going to break down exactly how to find these levels. You will learn the structural frameworks that actually work, so you can eliminate emotional trading and finally find some consistency.
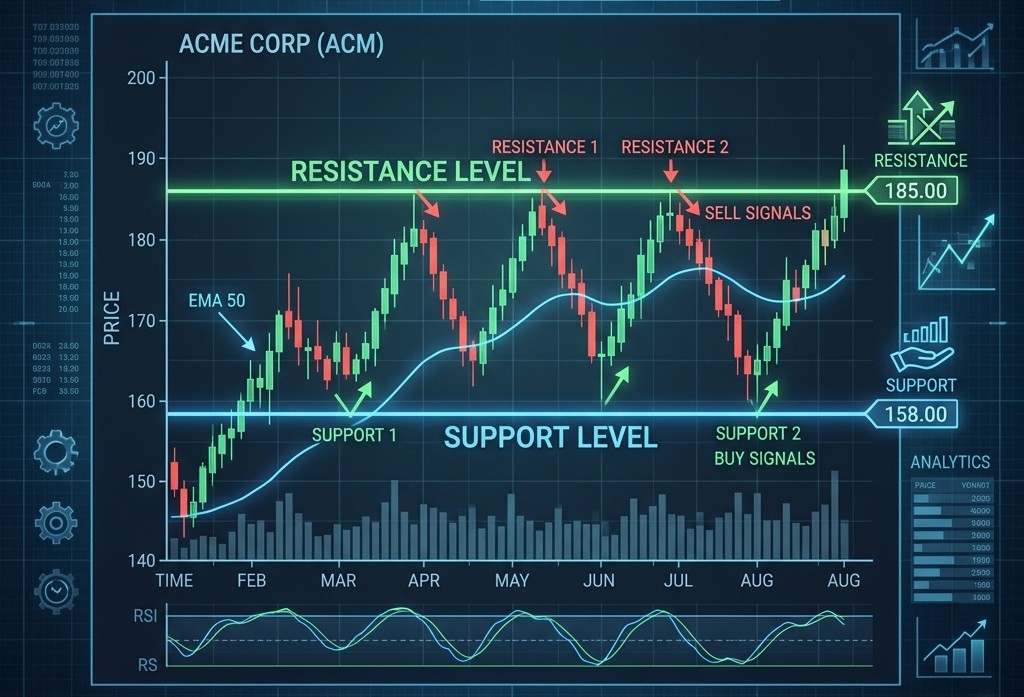
Understanding Support Levels
Support is the market floor. When prices drop, they eventually hit a point where buyers step in. Demand overwhelms supply. The price stops falling and bounces up.
Why does this happen? Simple psychology. Buyers see the lower price as a bargain. Sellers get exhausted and stop pushing the price down. The market creates a structural turning point based on human behavior.
You need to wait for these floors before buying. Buying in the middle of a drop is just gambling. Waiting for price to touch support and show a clear rejection is disciplined trading.
Understanding Resistance Levels
Resistance is the market ceiling. When prices rise, they eventually hit a level where sellers take control. Supply overwhelms demand. The rally runs out of gas and reverses violently.
Sound familiar? You probably bought right at this ceiling before, huh? We have all done it.
You must look at these ceilings to take profits or enter short positions. It removes the emotion from exiting a trade. When the price hits your resistance target, you simply close the position and walk away – or reduce your position size and watch what happens at the level. Support and Resistance levels don’t stay forever. They break at a point.
Identifying Support and Resistance Levels
The market leaves clues if you know where to look. There is no foolproof way to draw these levels, but there are proven methods. We use a few core frameworks to map out the chart before risking a single dollar.
The Swing Point Method
Look at historical price action. You want to find the obvious peaks and troughs. Connect the highs to the highs, and the lows to the lows. If the price has bounced off a specific level two or three times in the past, it will probably bounce off that level again.
The Zone Approach
Treat these areas as zones, not exact lines. The market will rarely stop at an exact penny. Draw a box around the general area of reversal. If you expect a stock to turn exactly at $50.00, you will miss the trade.
Psychological Round Numbers
Humans love round numbers. Levels like $50, $100, or $1000 act as natural barriers. Huge institutional orders sit at these prices. Pay close attention when your asset approaches a major whole number.
Strategies for Trading with Support and Resistance
A level is useless without a rule-based strategy to trade around it. You need a structured framework to actually trade these zones. Here are three proven ways to do it.
The Range Trade Strategy
Buy the floor and sell the ceiling. When the market moves sideways, you just play the bounces. You buy at support and set your profit target at resistance. Keep your stop loss tight, just outside the support zone.
The Breakout Strategy
Wait for the ceiling to shatter. When price breaks through resistance with heavy volume, you enter the trade. Do not jump in early. Wait for a clear candle close above the zone to confirm the buyers are actually in control. Or you could wait for a retest.
The Role Reversal Strategy
Old ceilings become new floors. When resistance breaks, wait for the price to drop back down and test that exact same level. This is often called the polarity principle. It is the safest entry you can find for a swing trade.
Combining with Other Technical Indicators
Never trade a line on a chart in isolation. You need confluence. When multiple indicators tell you the same story, your win rate goes up dramatically.
Add a simple moving average to your chart. If a 50-day moving average lines up perfectly with your horizontal support zone, you have a high-probability setup.
Check your volume. Volume tells you if the big institutions are actually defending a level. If the price approaches support and the buying volume spikes, the floor will probably hold. Low volume means the level will probably break.
Common Mistakes to Avoid
Most of us ruin a good strategy with bad discipline. It is easy to get chopped up if you do not follow strict rules. Avoid these exact traps.
- Placing stops directly on the line. The market will hunt your stop loss. Give your trade room to breathe by placing your stop slightly beyond the zone.
- Ignoring the higher timeframe. A five-minute support level means nothing if the daily chart is crashing. Always check the bigger picture first.
- Trading every single touch. You do not need to take every setup. Wait for clear price-action confirmation, such as a strong rejection candle, before risking your money.
Building a Disciplined Trading Plan
Consistency comes from structure, not luck. Now you know what support and resistance in trading actually are. But knowledge is not enough. You have to actually use these frameworks to eliminate your emotional trading habits.
Stop buying blindly. Map your levels, wait for the price to come to you, and execute your plan without hesitation.
Trust the process (it just works).