Best Timeframe for Swing Trading Forex (What Actually Works)

Most traders fail because they look for answers on the wrong chart. You have probably spent hours staring at a 15-minute chart, watching a candle turn green, jumped into a trade, and immediately got stopped out because the market reversed. Well, the market never intended to move.
You might think that watching lower timeframes gives you an edge or better pricing. Here’s the fact: jumping between five different charts usually just leads to emotional trading, and your account suffers. If you want consistent profitability, you need structure.
But hey!
There is no single perfect timeframe — but there is a most efficient structure. We are going to show you exactly how to build that structure. By the end of this guide, you will know how to choose the right timeframe, match it to your specific strategy, and this will significantly reduce false signals.
The Reality of Swing Trading Forex
Here is the reality: most traders fail at swing trading because they treat it like day trading. They stare at the screen all day waiting for a magical setup. I imagine you might have already tried that and ended up stressed out and unprofitable, huh? Well, that’s very familiar.
Swing trading is designed to capture medium-term price moves. Instead of closing your positions intraday, you hold trades for a few days to a few weeks. It requires patience. It requires a rule-based framework. Most importantly, it requires the right timeframes to filter out intraday market noise.
When you use the right timeframes, you stop making emotional decisions based on tiny price spikes. You start seeing the broader market structure.
Get the foundation right. The profits will follow.
What Is a Swing Trading Timeframe (And Why Does It Matter?)
What exactly is a swing trading timeframe, and why should you care? Simply put, a timeframe dictates how price data groups together on your trading chart. This setting is crucial because it directly controls signal strength, filters market noise, and determines the size of your stop-loss.
Think of timeframes like magnifying a map. If you zoom in too far by using smaller timeframes, you see every tiny detail but lose the broader perspective. Conversely, if you zoom out too far using higher timeframes, you miss the precise details needed to time your entries and exits. Finding the perfect balance is essential for your trading success.
Despite this, many traders make a critical error when starting out. They pick a timeframe first and then try to squeeze their trading strategy into it. This approach is completely backward. Your personal strategy, daily schedule, and risk tolerance must dictate your timeframe—never the other way around.
Understanding Timeframes: Daily, 4-Hour, and Weekly
You cannot build a house without a blueprint. In forex, your timeframes are your blueprint. Zoom out too far, and your stop loss will be massive. Zoom in too close, and market noise will chop you to pieces.
Here’s your perfect combo if you’re a forex swing trader:
The Weekly Chart: This is your map. You do not execute trades here, but you use it to see the long-term trend. Institutions respect major support and resistance levels on the weekly chart.
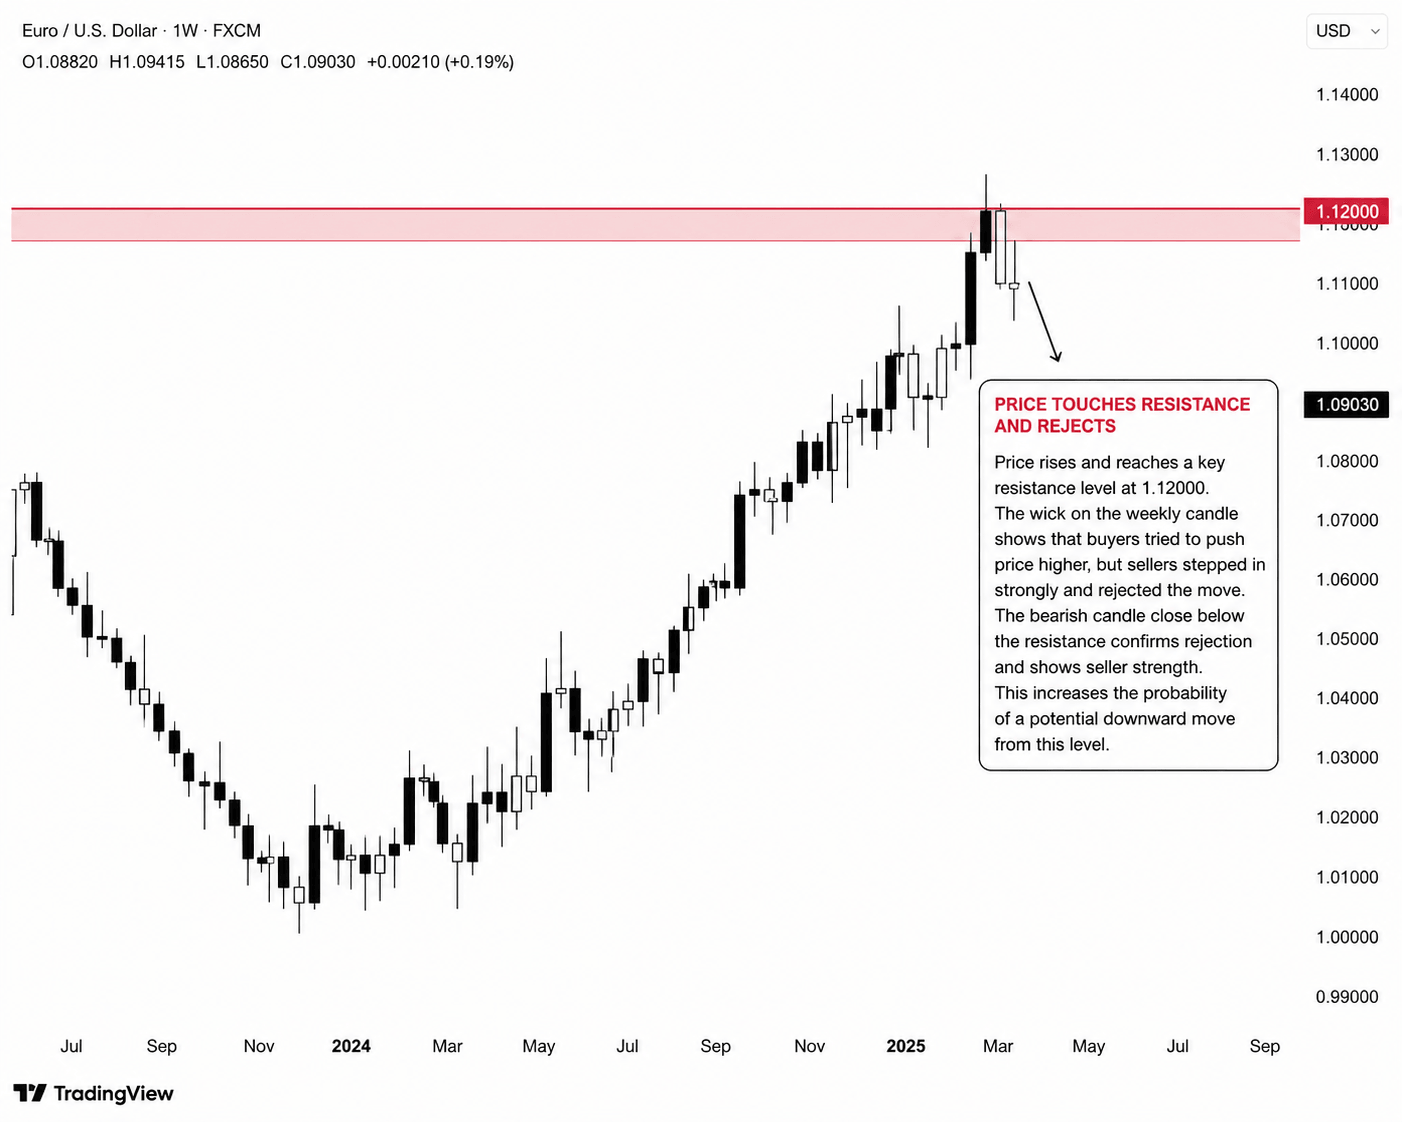
The Daily chart is your compass. This is the best place to identify the true trend direction and draw your major support and resistance zones. In other words, the daily timeframe shows you who is actually in control of the market—buyers or sellers.
EURUSD daily time frame support and resistance area with a clear rejection:
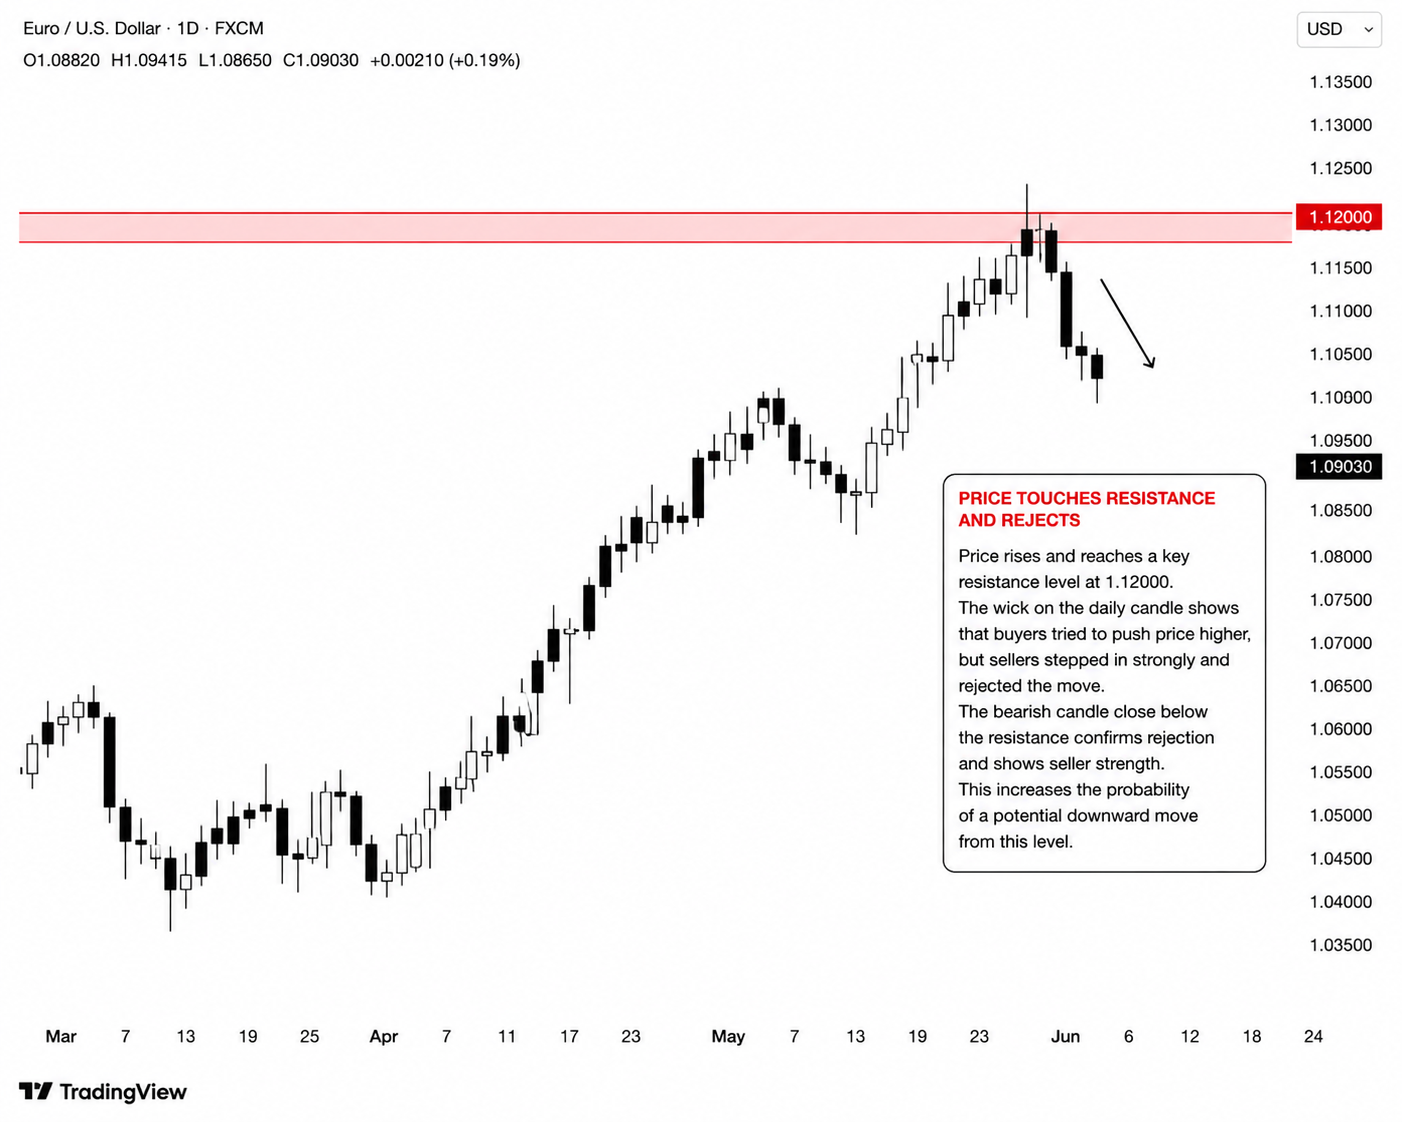
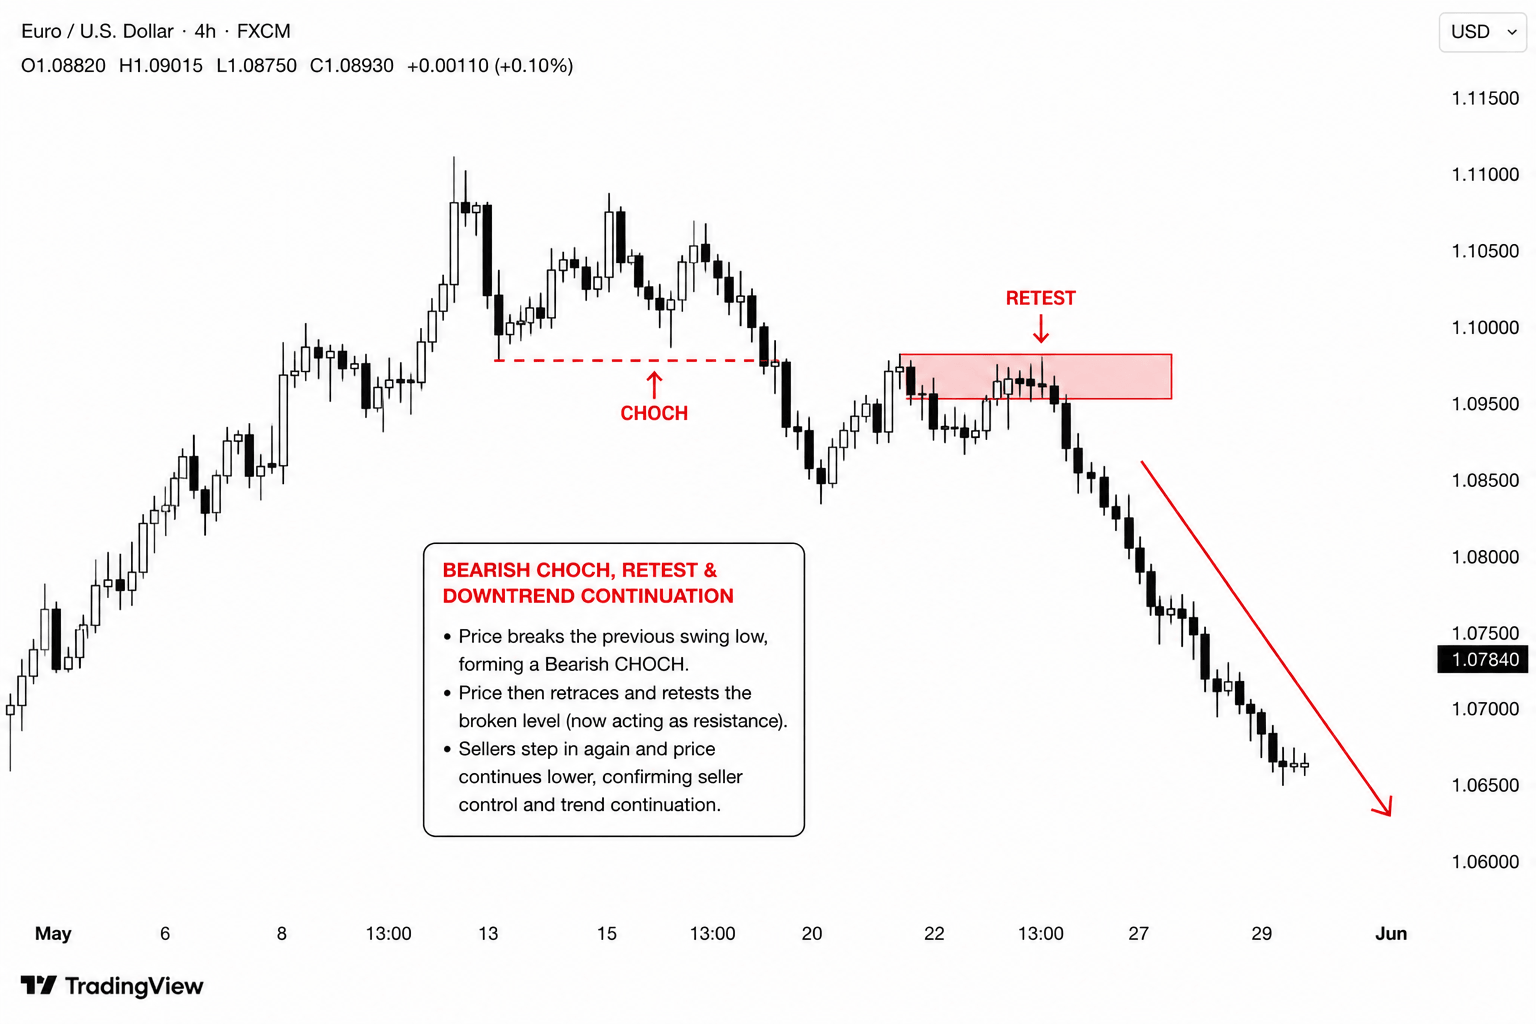
The 4-Hour Chart: This is your trigger. Once you know the trend from the daily chart, you use the 4-Hour to find your exact entry point. The chart below shows an SMC style of trading the 4-hour chart
Here is a quick breakdown of how these timeframes compare:
|
Timeframe |
Best Used For |
Signal Quality |
Typical Holding Time |
Common Mistake |
|---|---|---|---|---|
|
Weekly |
Identifying the macro trend |
Very High |
2 to 8 weeks |
Using it for trade entries |
|
Daily |
Primary analysis and bias |
High |
3 to 10 days |
Ignoring the weekly context |
|
4-Hour |
Timing entries and exits |
Moderate-High |
1 to 5 days |
Trading against the daily trend |
Understand these roles, and you stop fighting the market.
The Sweet Spot: The 4-Hour and Daily Chart Combo
The secret to successful swing trading is aligning your timeframes. We call this The Core Chart Combo.
Using the daily chart for your bias and the 4-hour chart for your execution is the sweet spot. The daily timeframe provides reliable price-action signals. A bullish engulfing candle on a daily chart means something. The same candle on a 5-minute chart is just random noise.
But entering directly on the daily chart often requires a massive stop loss. That is why you step down to the 4-hour chart. The 4-hour gives you a tighter entry point, which improves your risk-to-reward ratio. You get the reliability of the daily trend with the precision of a shorter timeframe.
Once you lock this in, you will stop second-guessing your entries. Master this combo, and the rest gets easier.
Analyzing Market Conditions for Entries and Exits
Market conditions dictate your strategy. You cannot use a trending strategy in a ranging market and expect to win.
The Trending Market Strategy. When the daily chart shows clear higher highs and higher lows, you are in an uptrend. Your job is simple: wait for price to pull back to a key level on the 4-hour chart, and buy. You want to capture the next swing in the direction of the trend.
The Ranging Market Strategy. When price is bouncing between a clear ceiling (resistance) and floor (support), the market is ranging. Here, you buy the floor and sell the ceiling.
[Image Placeholder: A split-screen graphic showing a clear uptrend on a EUR/USD daily chart on the left, and a ranging, sideways market on an AUD/USD daily chart on the right.]
You need to know what environment you are in before you risk a single dollar. If the daily chart looks like a messy knot of candles, sit on your hands. Patience is a strategy.
Choose the timeframe, identify the condition, then execute the plan.
Risk Management Strategies for Swing Trading
Perfect selection of a timeframe is not as important as position sizing and risk management. You can have the best timeframe strategy in the world, but if your risk management is bad, you can still lose money.
The 1% Protection Framework. Never risk more than 1% of your total account capital on a single trade. If you have a $10,000 account, your maximum risk per trade is $100. This rule keeps you in the game when you hit a losing streak.
The ATR Stop Loss Method. The Average True Range (ATR) indicator tells you how volatile a currency pair is. Instead of picking a random number of pips for your stop loss, use the ATR. If the daily ATR is 80 pips, place your stop loss at least 1x or 1.5x the ATR below your entry price. This prevents you from getting stopped out by normal market fluctuations.
Protect your capital first. The profits will take care of themselves.
Real-World Example and Case Study
Let’s look at an example of how timeframe alignment swing trading plays out in the real world. We will use the EUR/USD pair as our example.
Step one is checking the weekly chart for the broader market direction. Step two is checking the daily chart. You notice that EUR/USD has broken through a major resistance level and closed above it. The weekly and the daily trend are officially bullish.
Step three is moving to the 4-hour chart. You don’t buy immediately. You wait for the price to retest the broken resistance level (now acting as support).
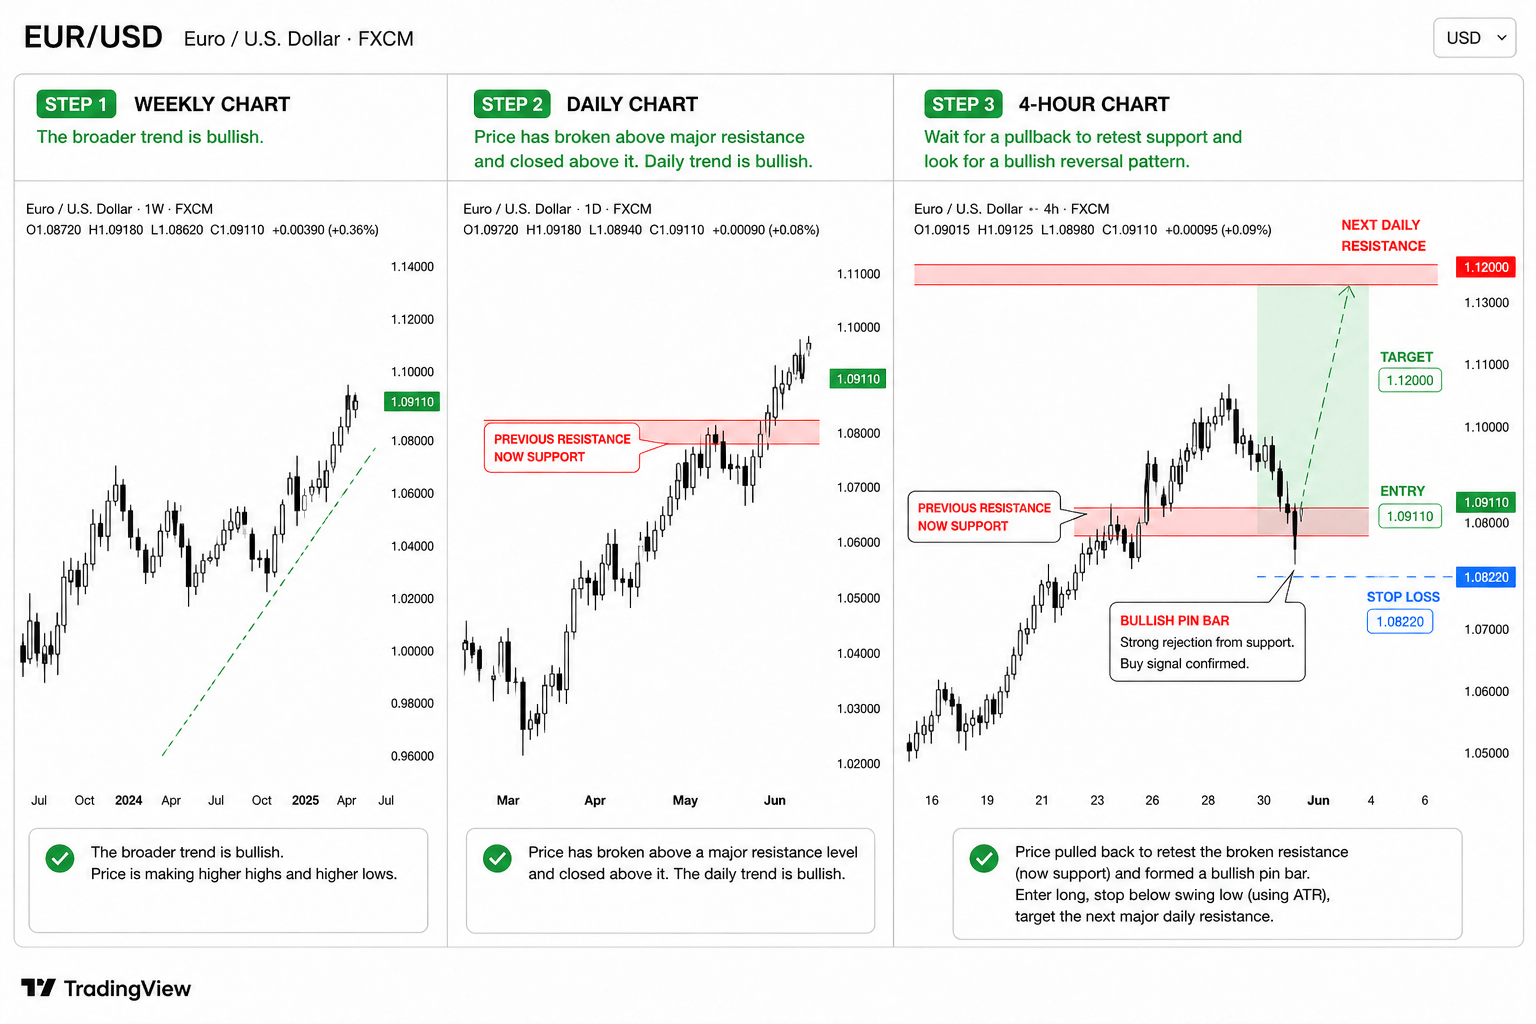
Once you see a bullish reversal pattern on the 4-hour chart—like a strong pin bar—you enter the trade. You set your stop loss below the recent swing low using the ATR, and you target the next major daily resistance level. Reverse the situation for a bearish setup.
This is not a guess. This is a structured, repeatable framework.
Advanced Techniques: Multi-Timeframe Analysis and Indicators
Once you have the timeframe analysis figured out, you can start using technical indicators to confirm it. But remember: indicators support your price action; they do not replace it.
The RSI Confirmation Strategy. Use the Relative Strength Index (RSI) on your execution timeframe. If you are entering on a 4-hour chart, wait for the 4-hour RSI to enter into oversold territory during a daily uptrend. This confirms the pullback is losing steam.
The MACD Momentum Shift. The MACD is excellent for spotting trend exhaustion. If price is making a lower low on the 4-hour chart, but the MACD is making a higher low, you have bullish divergence. If this occurs at a major daily support level, it is a high-probability buy signal.
Keep your charts clean. You only need one or two indicators to confirm what the price is already telling you.
Common Pitfalls to Avoid
Even with the right timeframes, traders fall into the same predictable traps. We have seen these mistakes destroy accounts faster than a bad strategy.
Analysis Paralysis. Looking at too many timeframes will freeze you. If you check the weekly, daily, 4-hour, 1-hour, and 15-minute charts, you will always find conflicting signals. Stick to your core timeframes. Which is ideally the Weekly > Daily > 4-hour for swing trading.
Overtrading the Noise. It is tempting to drop down to the 15-minute chart just to “feel” the market. Don’t do it. You will end up taking low-quality trades that violate your rules.
Ignoring the News. Swing trades are held for days. That means you will likely hold positions through high-impact news events like NFP or interest rate decisions. You should check the economic calendar. If a massive news event is coming, tighten your stops or reduce your position size.
Trading is boring when done right. Embrace the boredom.
Mastering Timeframes for Consistent Profits
Finding the best timeframe for swing trading forex isn’t about magic. It’s about aligning your strategy with the market’s rhythm.
Use the weekly chart for perspective. Use the daily chart to set your directional bias. Use the 4-hour chart to enter with precision. When you follow this rule-based approach, you eliminate the emotional guesswork that destroys most retail traders.
You no longer have to stare at charts all day. Let the higher timeframes do the heavy lifting while you manage your risk and execute your plan.
Stop guessing and start trading the structure.
If you’re ready to trade confidently without sacrificing your 9-5 job:
 Explore DavronFX and see how structured swing trading signals can fit into your schedule.
Frequently Asked Questions
How long are trades typically held on a swing trading timeframe?
Swing trades generally last anywhere from a few days to several weeks. If you build your strategy around a 4-hour chart, your positions might stay open for just a few days. If you base your decisions on a daily chart, you can expect to hold your trades for a few weeks as the longer-term trend develops.
Should I choose my strategy or my timeframe first?
You should always define your trading strategy, daily schedule, and risk tolerance first. Many people mistakenly choose a timeframe and then try to force their strategy to fit it. Instead, let your goals and available time determine your timeframe. If you work a full-time job, a daily timeframe will fit your life much better than a fast-paced 1-hour chart.
How many timeframes should I look at simultaneously?
Most successful swing traders use two to three timeframes to get a complete picture of the market. A common approach is to look at a higher timeframe (such as a weekly chart) to identify the broader trend, use a primary timeframe (such as a daily chart) to spot your trading setup, and switch to a lower timeframe (such as a 4-hour chart) to fine-tune your entry and exit points.