What Are Trade Signals and How to Use Them Without Blowing Up Your Account
Every trader eventually runs into the same problem: when exactly should I enter or exit a trade? Charts move fast, emotions kick in, and decisions become reactive instead of structured. This is where trade signals can help.
If you’ve ever asked yourself, ” What are trade signals?, the simple answer is that they are structured cues that help traders identify potential buying or selling opportunities in the market. These signals can come from indicators, price behavior, or even economic events—but their real value lies in helping traders make decisions with clarity instead of guesswork.
Trade signals can be as simple as a moving average crossover or as a multi-timeframe setup combining price action with macroeconomic context. The difference between a useful signal and noise usually comes down to the methodology behind it. This is exactly what we build at DavronFX: swing trade signals backed by defined rules, clear invalidation levels, and disciplined execution plans.
This article breaks down the core types of trade signals, walks through real examples, and explains how to use them effectively. Whether you’re generating your own signals or evaluating a signal service, you’ll leave with a practical understanding of how each piece fits into a complete trading process.
What trade signals are and what they include
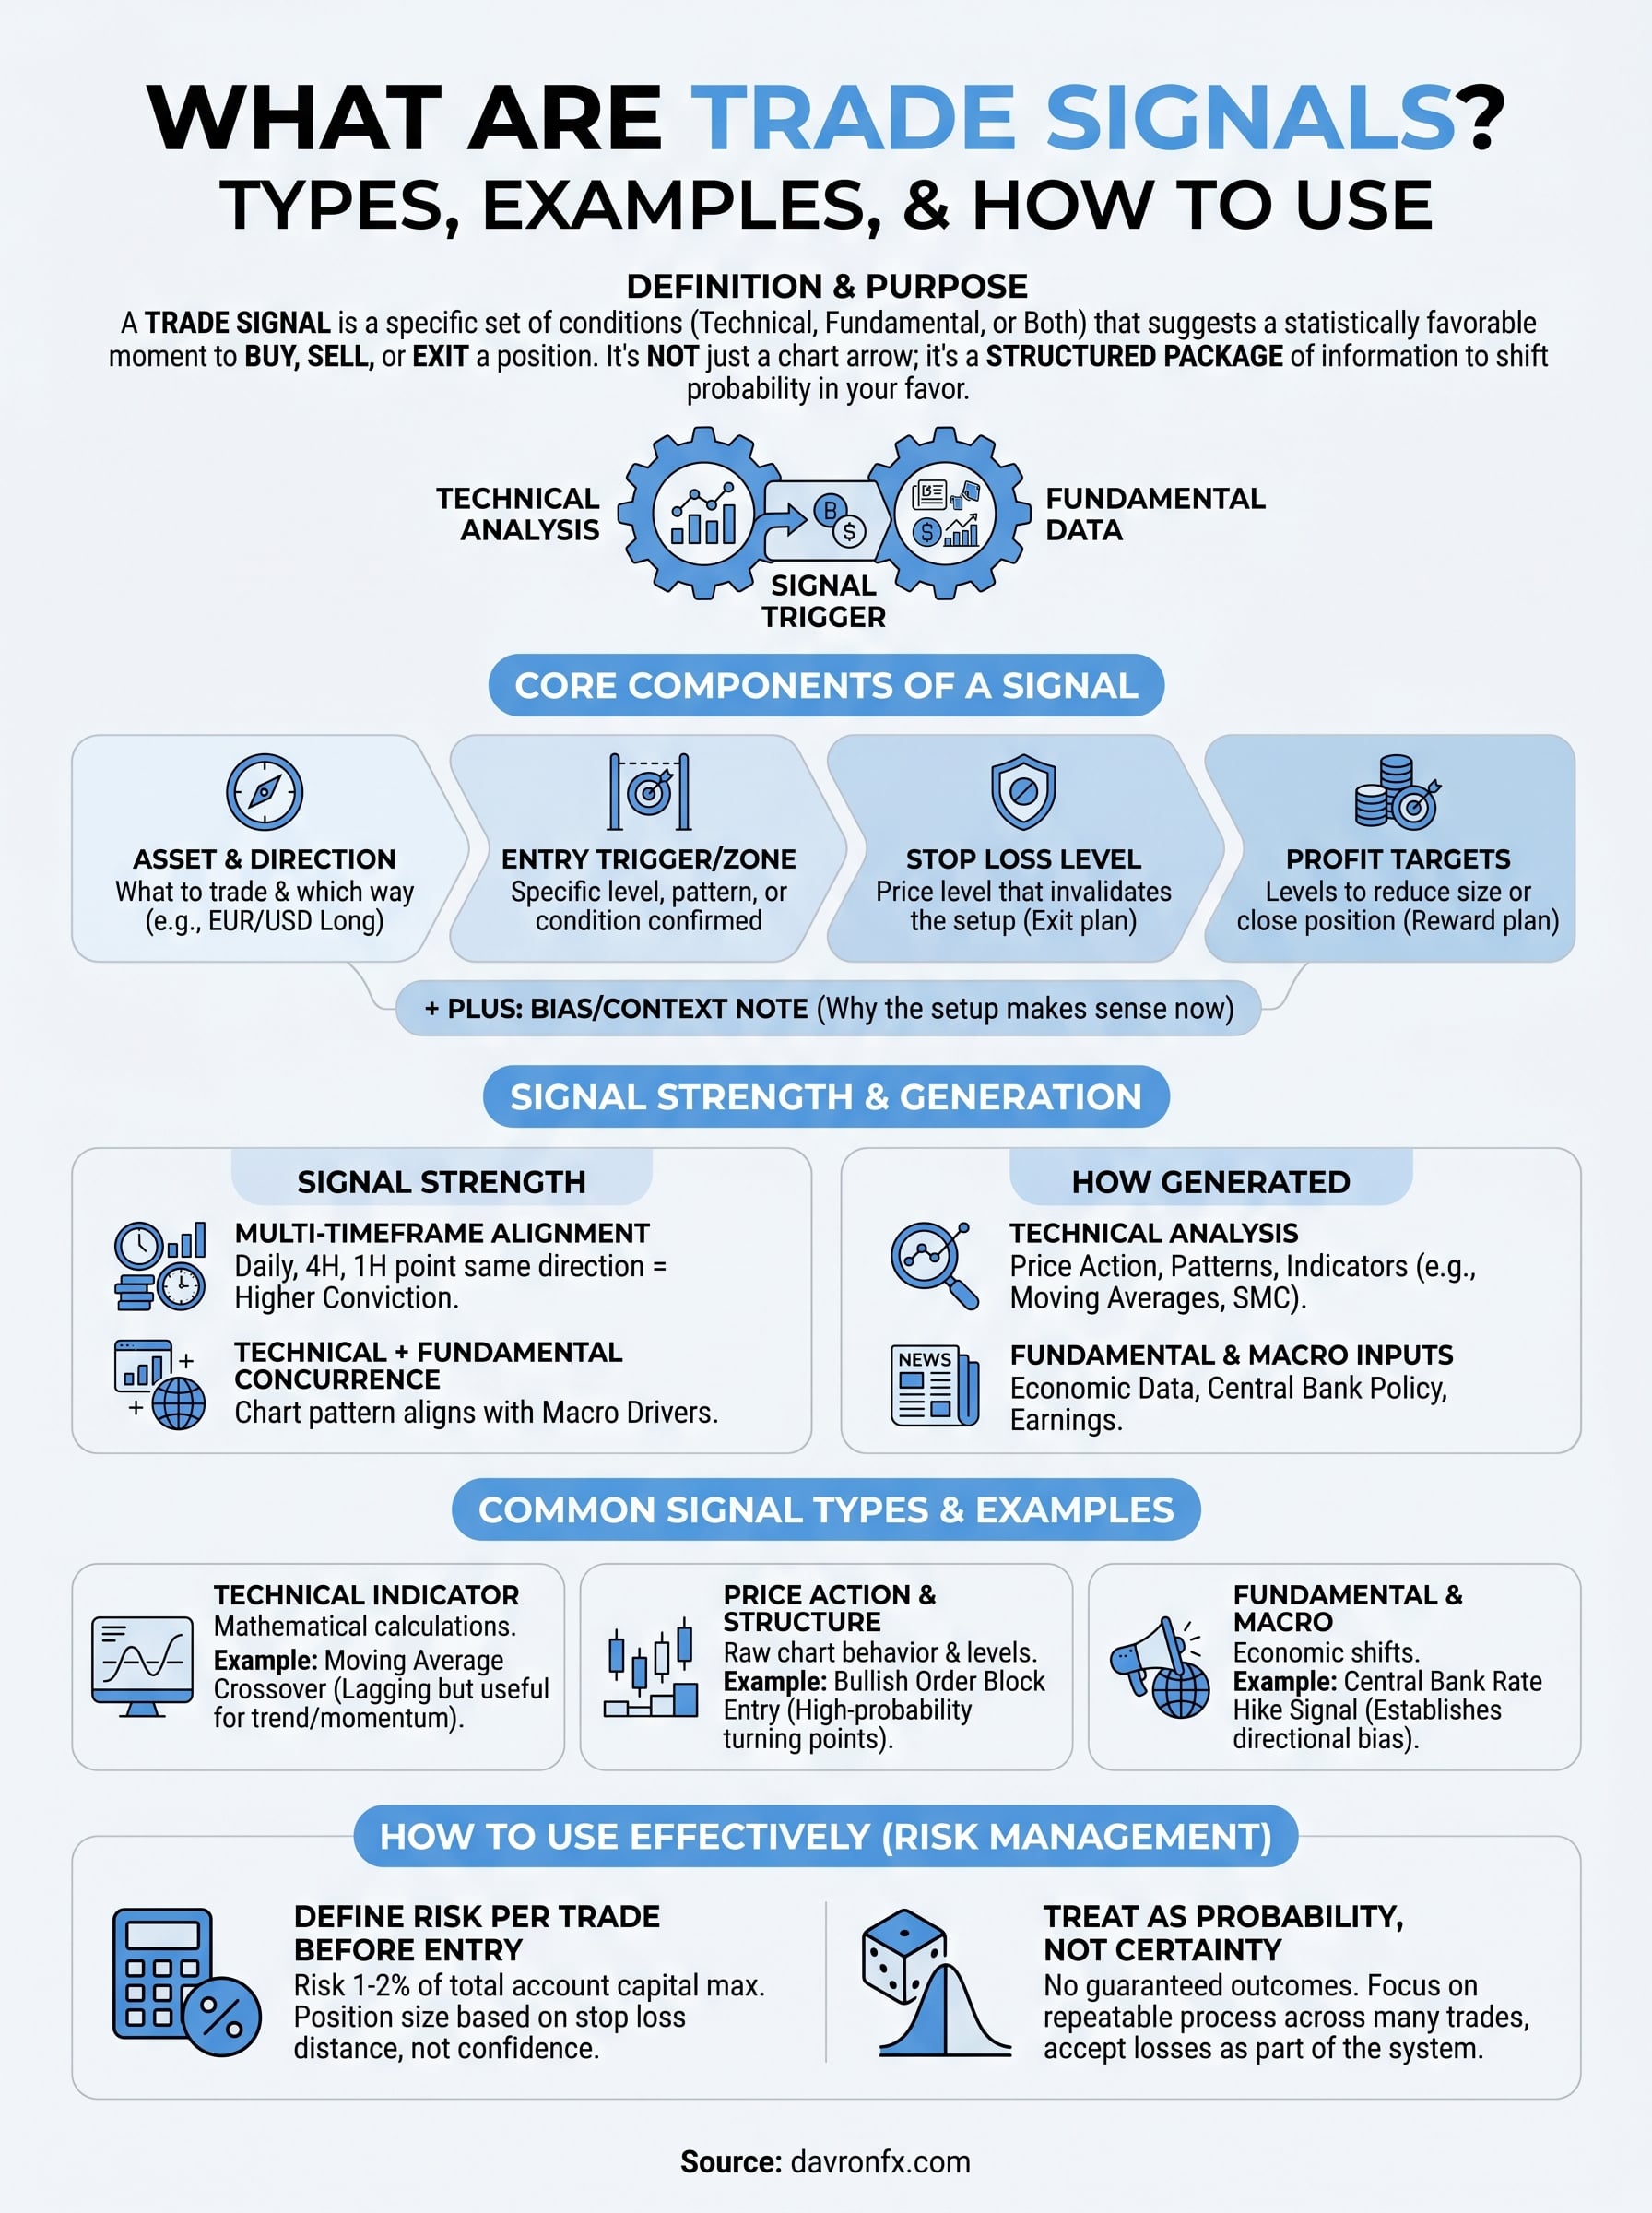
When you break down what trade signals are at their most functional level, you find they’re not just arrows pointing at a chart. A trade signal is a specific set of conditions that, when met simultaneously, suggest a statistically favorable moment to enter or exit a trade. Those conditions can come from price behavior, market structure, economic data, or a combination of all three. The signal itself doesn’t guarantee a winning trade. What it does is shift probability in your favor when you apply it consistently within a defined framework and stick to the rules every time.
Most traders think of signals as just buy here and sell there, but a well-constructed signal is actually a package of information. It tells you what to buy or sell, when to act, where to place your stop loss, where to take profit, and the reasoning behind the trade. If there’s no context behind the signal, you’re not trading—you’re just guessing where price might go.
No context means no edge—just a chart and a guess.
The core components of a trade signal
A high-quality signal goes beyond “buy” or “sell.” It specifies the asset, direction, entry conditions, stop loss, and targets—while clearly outlining the technical narrative, fundamental backdrop, and what would invalidate the trade. The context tells you why the setup is valid at that moment. That context matters because a technically clean signal inside the wrong macro environment can still produce a loss.
Here’s what those components typically look like:
- Asset and direction: EUR/USD long, Gold short, S&P 500 long
- Entry trigger: Price reaches a specific level, a pattern completes, or a condition gets confirmed on a defined timeframe
- Stop loss: A price level that if price reaches there, you know that you’re wrong and exit.
- Profit targets: One or more predefined levels where you take partial profits to reduce exposure, while allowing the remaining position to run, or exit the trade entirely.
- Technical Narrative: A concise explanation of how current price action justifies taking a position at this moment.
- Fundamental Narrative: A brief overview of the macro context surrounding the asset and why it supports the trade idea.
Each element serves a clear purpose. Remove any one of them and you shift the outcome from a repeatable process to a decision made in the moment, which is exactly the behavior that produces inconsistent results over time.
Signal strength and context
Not all signals carry equal weight. A signal that aligns across multiple timeframes, where the weekly, daily, and 4-hour charts all point in the same direction, carries more conviction than a signal that appears on a single timeframe in isolation. The same logic applies when technical structure lines up with fundamental drivers, such as a currency pair forming a bullish reversal at a key support zone while the macro backdrop favors buying the base currency.
You must consider timing, not just the presence of a signal. The same setup ahead of a key economic event behaves very differently compared to one in stable market conditions. Timing and context are embedded in the signal itself, not separate from it. When you evaluate a setup without looking at the broader environment, you’re working with incomplete information, and that gap tends to show up in your results.
Signals work best when you treat them as structured arguments for a trade, not as commands. The components tell you what the market is suggesting. Your job is to verify that the conditions actually match the criteria before you act.
How trade signals get generated
Understanding what trade signals are at a mechanical level means looking at the process behind their creation. Trade signals don’t appear randomly on a chart. They are produced through systematic analysis of price data, market structure, and external market information that traders apply consistently to identify when conditions align for a potential entry.
Whether they come from technical models, price action frameworks, or algorithmic systems, credible signals always follow structured criteria that reduce ambiguity and make decision-making more consistent.
The generation process varies depending on the strategy, but every reliable approach shares one key feature: it relies on repeatable rules that filter noise and highlight only high-probability conditions for action.
Technical analysis as a signal source
Most trade signals start with technical analysis. This means reading price action, chart patterns, and indicator data to find moments where the market has historically shown consistent directional movement. Common technical inputs include moving averages, support and resistance zones, candlestick patterns, and momentum oscillators. When specific combinations of these inputs trigger simultaneously, they produce a signal that meets the criteria to act.
The most reliable technical signals don’t rely on a single indicator. They emerge when multiple technical conditions confirm the same direction at the same time.
For example, traders using structured methodologies like Smart Money Concepts (SMC) or ICT build signals around institutional footprints in the market, including order blocks, fair value gaps, and liquidity sweeps. These approaches look for evidence of where large market participants have positioned themselves and generate signals based on price returning to those zones under the right market conditions.
Fundamental and macro inputs
Technical signals tell you where price might move. Fundamental analysis tells you why it is likely to move in that direction over a broader timeframe. For swing traders specifically, fundamental inputs include central bank policy direction, inflation data, employment figures, and earnings reports. These factors create the macro bias that determines which technical signals deserve attention and which ones work against the dominant trend.
Blending both inputs makes your trade signals far more reliable. When a currency pair forms a bullish reversal pattern and the underlying fundamentals also favor buying that currency, the setup becomes much stronger. If that alignment is missing, you’re relying only on a technical pattern, which increases the risk of being caught off guard by the overall market trend and weakens the quality of your signal compared to a more disciplined, well-rounded approach.
Common types of trade signals
When exploring what trade signals are across different trading styles, you’ll notice they tend to fall into a few clear categories. Each type relies on its own data sources and methods of analysis, but the most effective signals usually combine multiple approaches to form a stronger, more complete case for entering or exiting a trade. By understanding these categories, you’ll be better equipped to assess any signal—whether you generate it yourself or receive it from a signal service provider.
Technical indicator signals
Technical indicator signals are the most widely recognized type. They’re generated when a mathematical calculation applied to price data crosses a defined threshold or produces a recognizable pattern. Moving average crossovers, RSI readings above 70 or below 30, MACD line crosses, and Bollinger Band compressions all fall into this category. Each trigger tells you something specific about momentum, trend direction, or potential reversal conditions based on historical price behavior.
Indicator signals become more reliable when two or more indicators confirm the same direction before you act, rather than using a single trigger in isolation.
The challenge with indicator-based signals is that they are lagging by nature. They reflect what price has already done rather than predicting what it will do next. Using them as the only input in your signal process increases your exposure to false entries, particularly in choppy or ranging market conditions.
Price action and market structure signals
Price action signals don’t rely on indicators. They come directly from reading raw candlestick behavior and structural levels on the chart. Pin bars, engulfing candles, inside bars, and multi-candle reversal patterns all serve as signal types in this category. Traders using SMC or ICT frameworks extend this further by reading order blocks, fair value gaps, and liquidity sweeps as triggers, each tied to evidence of institutional positioning in the market rather than lagging calculations.
These signals work particularly well for swing traders because they align with high-probability turning points rather than mid-trend entries that carry elevated risk and reduced reward.
Fundamental and macro signals
Fundamental signals come from economic data releases, central bank decisions, and broader macro trends rather than chart patterns. A shift in interest rate expectations, a stronger-than-anticipated employment report, or a change in trade policy can all generate a directional signal for currencies, commodities, or indices. For swing traders, these signals establish the overall directional bias that determines which technical setups deserve attention and which ones to pass on entirely.
Trade signal examples you can recognize
Understanding what trade signals are in theory is useful, but seeing them in a real-world context is what truly makes them actionable. The examples below represent setups that appear regularly across forex, commodities, and indices. Each one includes a clear trigger, a logical stop placement, and a clear rationale behind the trade.
Moving average crossover signal
A moving average crossover is one of the most common technical signals. It occurs when a faster-moving average crosses above or below a slower one, confirming a shift in short-term momentum relative to the broader trend. For example, when the 20-period EMA crosses above the 50-period EMA on a daily chart for EUR/USD, that crossing acts as a bullish signal if price is already trading above both averages and the macro bias supports buying the euro.
The crossover itself is not the entry. The entry comes when price pulls back toward the faster moving average and holds, giving you a lower-risk point to join the move rather than chasing.
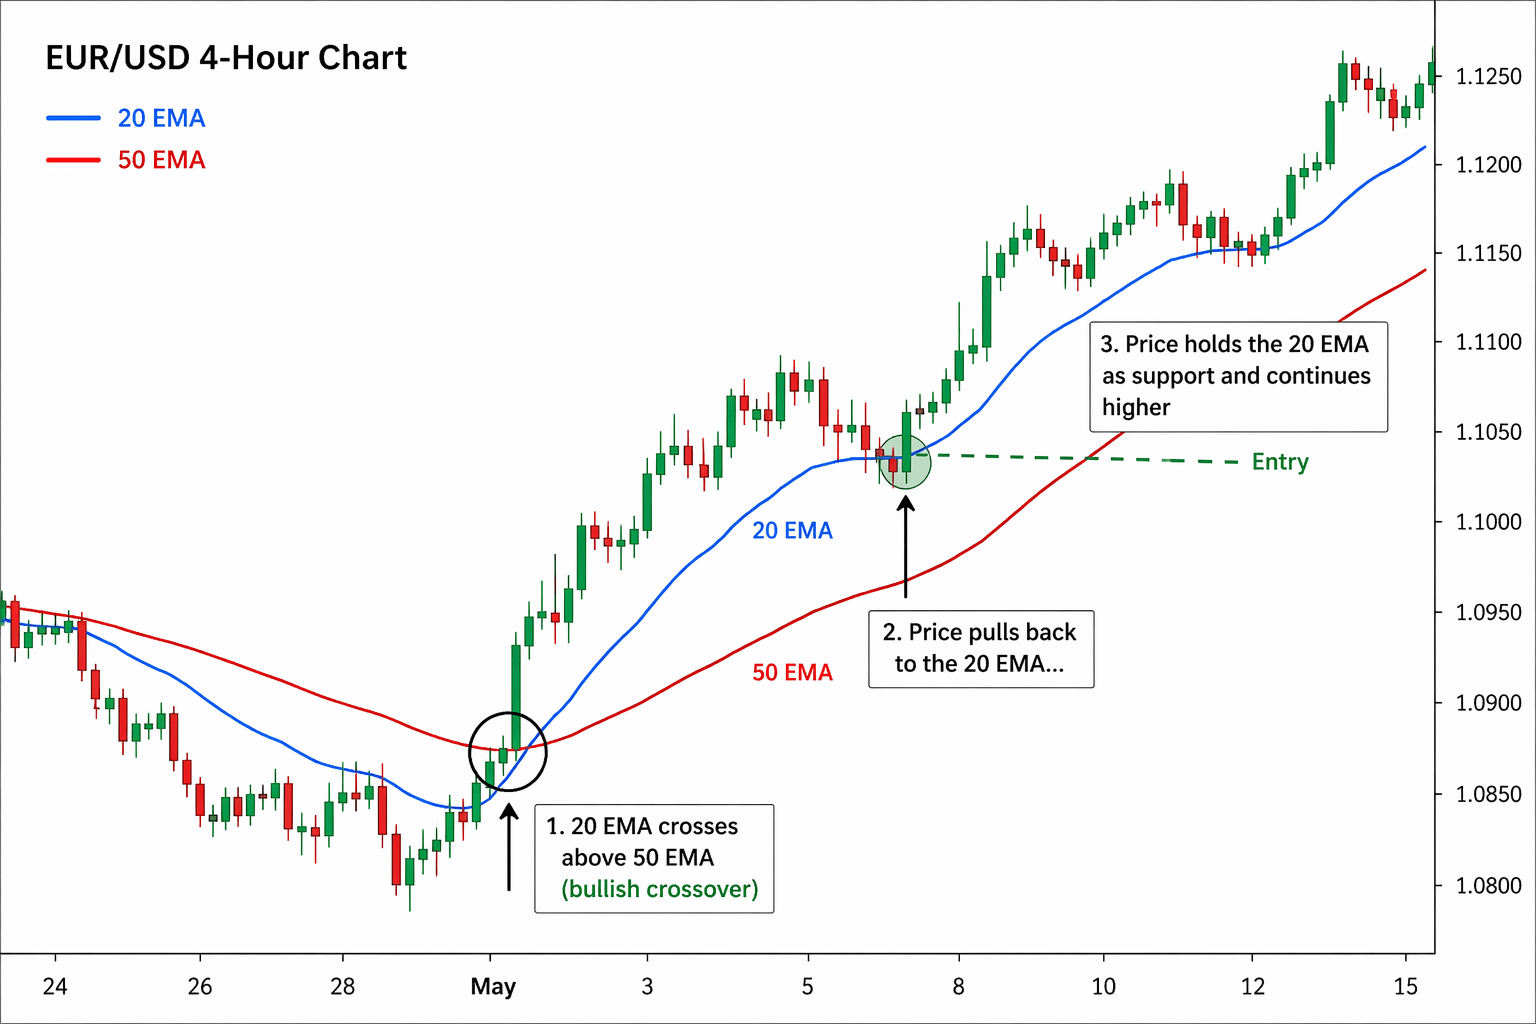
You would set your stop below the recent swing low and target the next major resistance zone. This structure keeps your risk defined and your reward potential proportional.
Bullish order block entry signal
An order block signal comes from smart money concepts and marks a zone where institutional buyers previously entered the market in size. When price returns to that zone after moving away sharply, the setup signals a high-probability reversal opportunity at a level with structural backing. On a four-hour gold chart, this might look like price sweeping a recent low, entering a demand zone that produced a strong upward move previously, and then forming a bullish candlestick confirmation before moving back in the original direction.
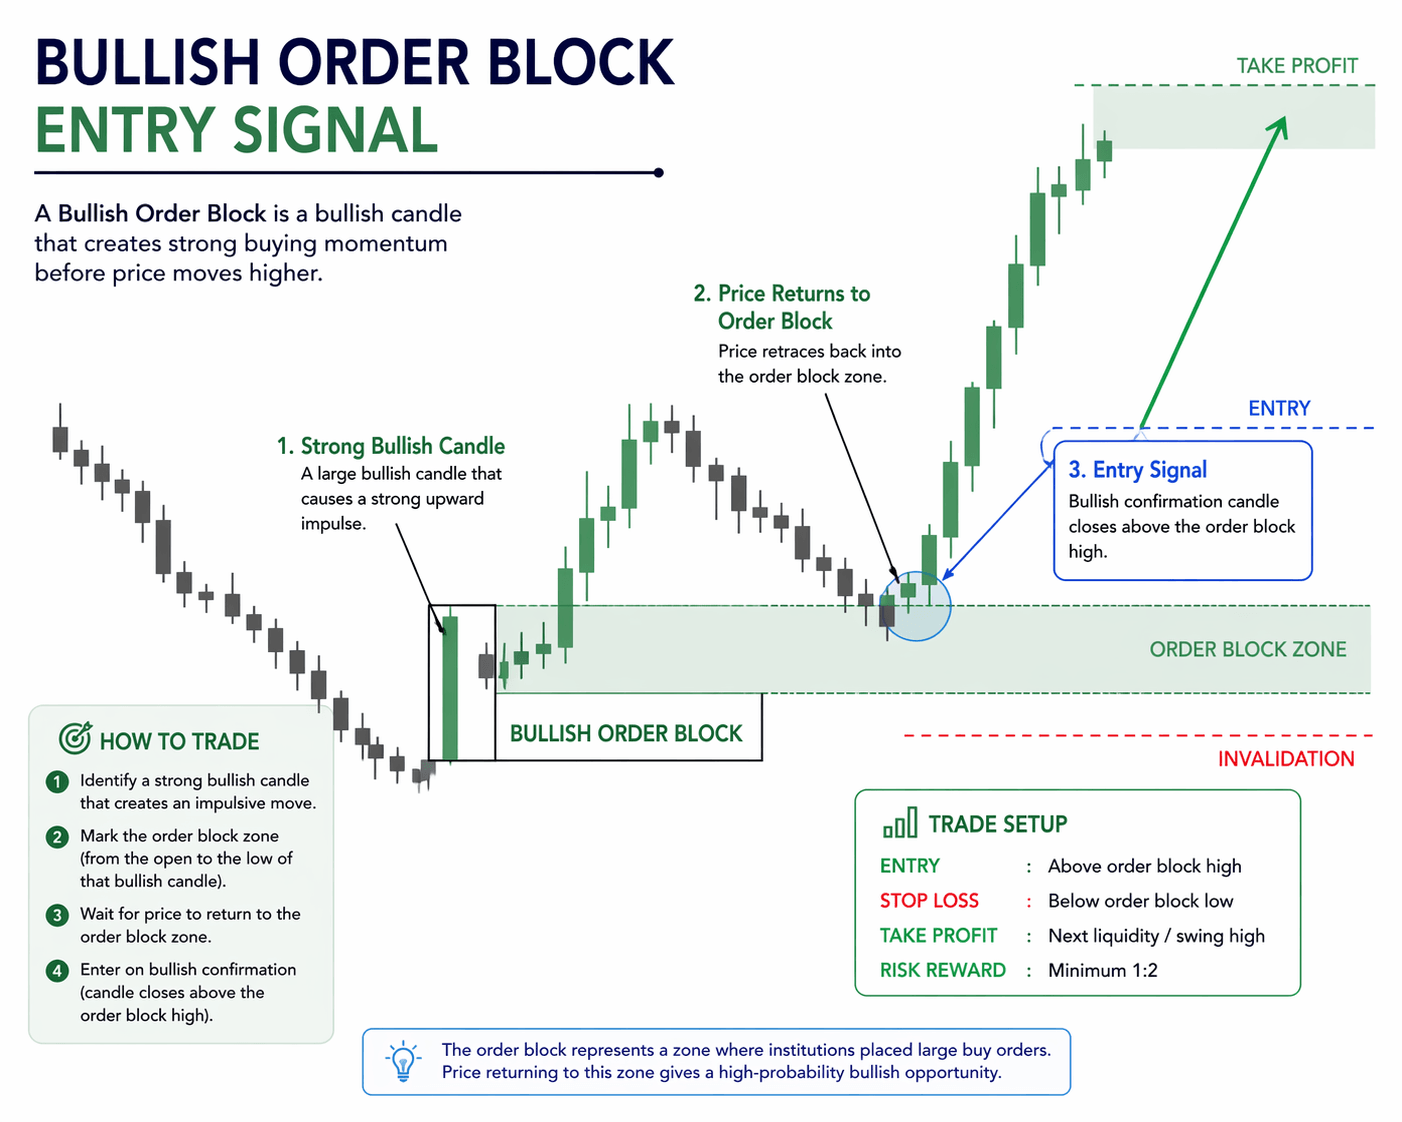
Your stop sits below the order block, and your first profit target aligns with the next area of supply or imbalance. The logic is straightforward: you are entering where institutional positioning suggests demand exists, not where a lagging indicator caught up to price.
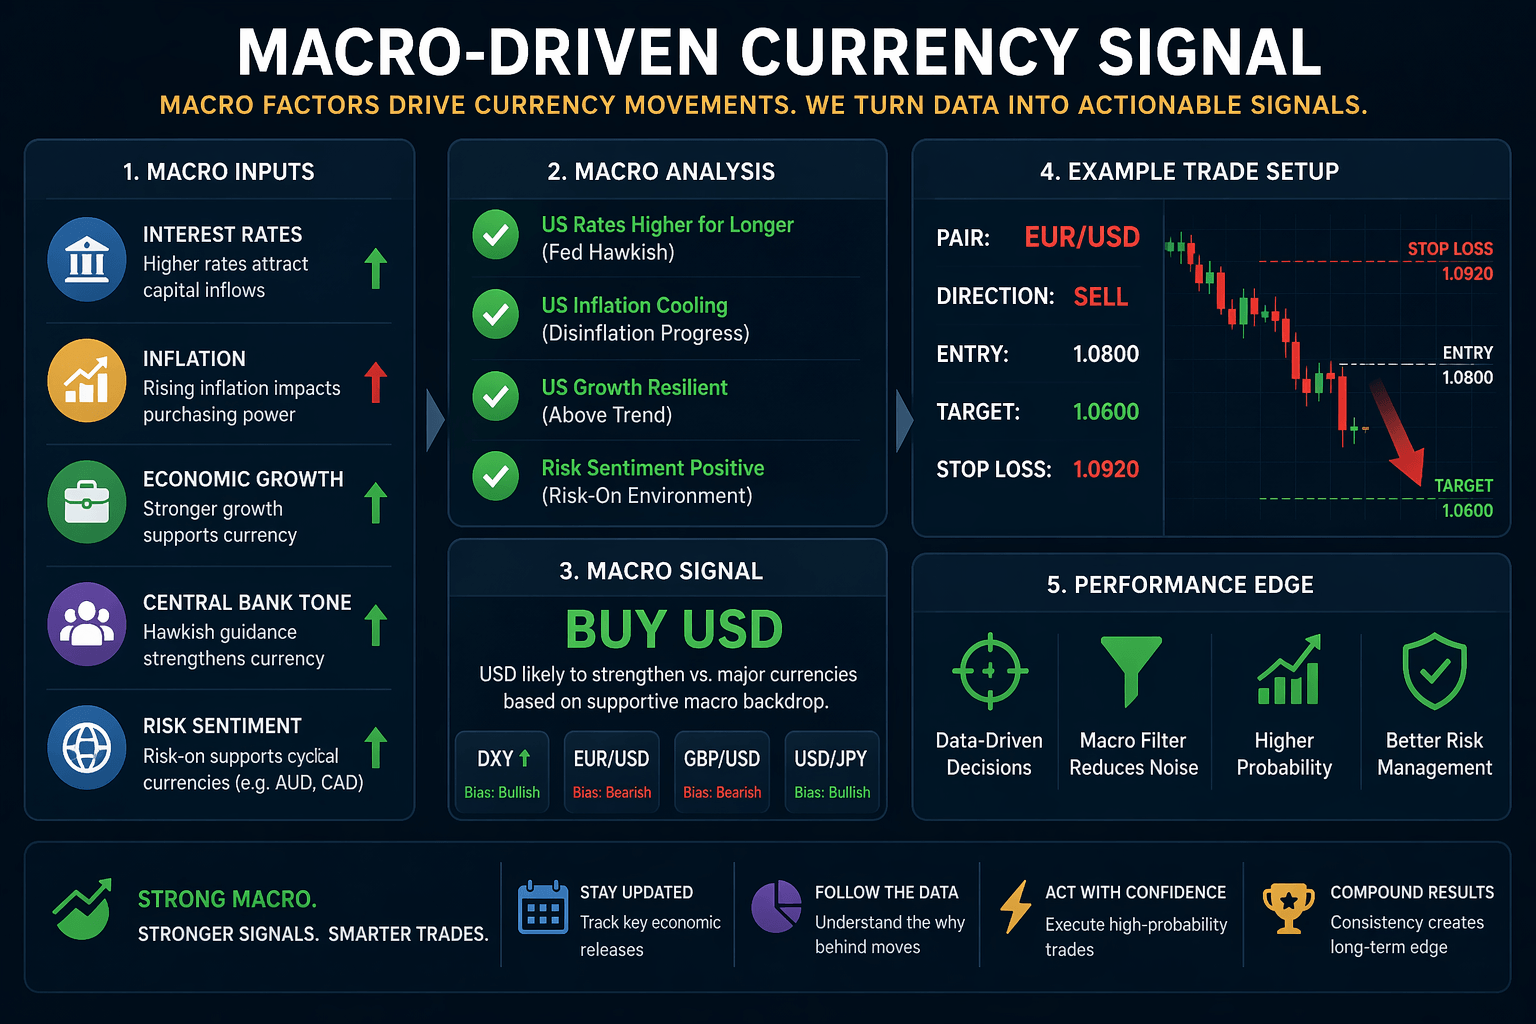
Macro-driven currency signal
A macro signal doesn’t start on a chart. It starts with a policy shift or economic data release that changes the directional bias for an asset. When a central bank signals rate hikes ahead of expectations, the affected currency typically strengthens. That shift creates a fundamental tailwind that makes technically bullish setups on that currency far more reliable than the same setups would be in a neutral macro environment.
How to use trade signals while managing risk effectively
Knowing what trade signals are gets you halfway there. Using them correctly is where most traders either build consistency or destroy their accounts. A signal tells you when conditions align for a trade. Your risk management system tells you how much capital you’re willing to put behind that idea. Without both working together, even a high-accuracy signal service can produce a net loss over time.
Define your risk per trade before you enter
Before you act on any signal, you need to know exactly how much you are risking on that position. The standard framework used by professional traders is to risk no more than 0.5-2% of total account capital on any single trade. That ceiling is not arbitrary. It keeps a losing streak from compounding into a catastrophic drawdown. Ten consecutive losses at 1% risk leaves you with roughly 90% of your capital intact. Ten consecutive losses at 10% risk leaves you with 35%.
The size of your position is not determined by how confident you feel in the signal. It is determined by the distance to your stop loss and your maximum acceptable dollar risk on that trade.
Calculate your position size using the distance between your entry and stop loss, then work backward to the number of units that keeps your dollar risk within that boundary. This process applies to every signal, regardless of how strong the setup appears on the chart.
If there is one rule in trading, it is this:
Good signals without risk control still lead to losses.
Treat each signal as a probability, not a certainty
No signal, regardless of how many confluent factors support it, produces a guaranteed outcome. Markets move based on information that no analytical framework captures completely. What a well-constructed signal gives you is a statistically favorable setup with clearly defined risk parameters. Your job is to execute that scenario consistently and let the edge play out across a series of trades rather than judging each individual result in isolation.
Accepting losses as part of the system is what separates traders who improve from those who repeat the same errors. A signal that fails does not automatically mean the analysis was wrong. It means the market did not follow through on that particular instance. When you document each trade, track whether your signal criteria were met correctly, not just whether the position was profitable. That discipline is what turns a signal from a one-time trigger into a repeatable, process-driven tool you can build on over time.
Putting signals to work
Understanding what trade signals are gives you the foundation to approach every trade with a structured, repeatable process instead of reacting to price in the moment. The most important shift is treating signals as one input inside a larger system, where your risk parameters, market context, and execution rules all work together. A signal only produces consistent results when you apply it with the same discipline every time, journal your trades, and adjust based on what the data shows rather than how individual outcomes feel.
If you want signals built on defined rules, clear invalidation levels, and real market structure analysis rather than vague chart commentary, that structure already exists. DavronFX swing trade signals combine technical precision with macro context so every setup comes with the information you need to act without second-guessing. Start with the process, and the results follow from there.