Price Action Trading Signals: How to Spot High-Probability Entries (With Clear Rules)
If you’ve ever entered a trade only to watch it reverse immediately, you’re not alone.
The issue isn’t bad luck—it’s a lack of structure.
The problem is that most traders misread the market’s feedback. They spot a pin bar or an engulfing candle, enter a trade without context, and wonder why the setup failed. For example, imagine you see a bullish pin bar appear in the middle of a range and jump in, only to have price roll over and hit your stop, because there was no supporting structure or key level behind the move. Now compare that with waiting for a pin bar to form at a clearly defined support zone within an established uptrend, planning your entry, stop, and target beforehand. In the second scenario, you have a framework that aligns pattern, context, and risk.
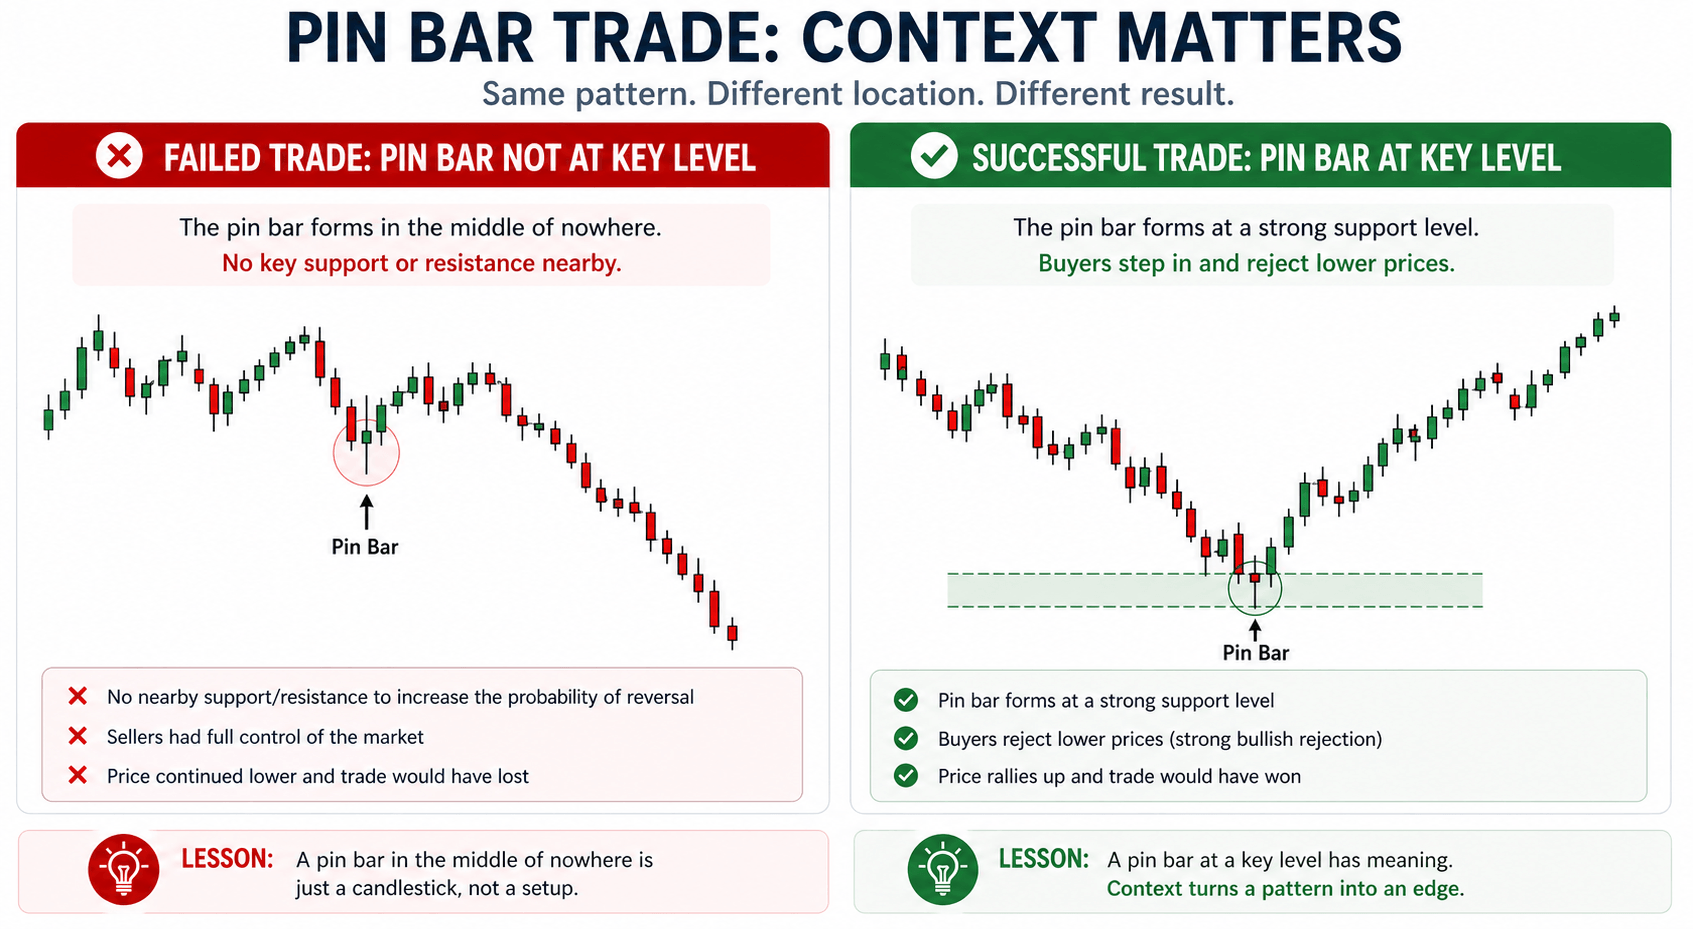
Here’s the thing: a candlestick pattern alone isn’t a signal; it becomes one when it forms at the right location, under the right context, and with a clear plan for risk. That distinction separates consistent traders from those stuck in a cycle of random entries and frustration.
Price action trading signals only work when you understand the patterns, timing, and rules behind them. To make this process actionable, there are a few core steps you need to master: first, identify the overall market structure to determine the dominant trend. Second, mark the key support and resistance levels where price is likely to react. Third, look for specific candlestick patterns at those levels that confirm your directional bias.
Throughout this guide, we’ll walk through each step so you can spot-clean setups and execute them with clarity. These are the same principles we build our swing trade signals around at DavronFX, structured setups with managed risk, not guesswork. Whether you’re refining an existing system or building one from scratch, this framework gives you something concrete to work with.
Why price action signals matter for swing traders
Swing traders operate in a window where timing matters more than most people realize. You’re not scalping seconds off a 1-minute chart, and you’re not holding a position for six months. You’re targeting multi-day to multi-week moves, which means a late entry doesn’t just cost you a few pips; it can completely flip the risk-reward ratio on a setup that looked clean at the open. Price action trading signals let you read the market in real time, without waiting for an indicator to confirm what price already did several candles ago.
The problem with lagging indicators
Most retail traders start with indicators because they’re built into every platform and they look objective. The issue is that every standard indicator is derived from past price data, which means by the time a signal fires, the move is often already underway. For a swing trader, that delay can mean entering near a reversal point instead of near the start of a move or at least, early into the move. You pay for that timing error directly in tighter profit potential, a blown risk-reward ratio, and stops that need to be wider to accommodate the late entry.
Reading price directly means your signals come from what the market is doing now, not a mathematical summary of what it did before.
Price itself carries no lag. When a key level holds and a reversal pattern forms, that information is available the moment the candle closes. You don’t need to wait for a secondary line to cross or a histogram to shift color. That immediacy is the core advantage price action offers, and for swing traders who need precise entries, it is a meaningful edge.
Why swing trading fits price action particularly well
Short-term traders deal with so much intraday noise that even clean price action setups get overshadowed by random volatility. Swing traders work on higher time frames, typically the 4-hour, daily, and weekly charts, where candlestick patterns and structural signals carry far more weight. A daily pin bar forming at a major support level is significant. The same candle on a 1-minute chart is statistical noise.
Your holding period as a swing trader also aligns with the natural rhythm of price action setups. Most high-quality signals need one to several days to develop into a full move. You’re not rushing an exit before the end of a session. That patience gives the setup room to play out, and it means your entry precision has a direct, measurable impact on your final profit or loss on that trade.
The discipline factor
This is the part most trading content glosses over. Price action signals compel you to define your reason for entering before you place the trade. You can’t point to a vague “the chart looked good.” You have to identify a specific candlestick pattern, at a specific level, backed by a specific structural context. That requirement builds accountability into your process, which is exactly what separates traders who develop a real edge from those who stay stuck in inconsistent results.
When you build a rule-based system around price action, you also build a record. Every setup either met your criteria or it didn’t, and that record is traceable. It lets you audit your own decision-making, identify where your actual edge exists, and cut the setups that consistently produce losing trades. Without a clear structure, you’re reacting to charts and calling it a system. With it, you have something you can refine, measure, and trust over time.
Core building blocks: market structure and levels
Before you can read price action trading signals correctly, you need to understand what you’re reading them against. A candlestick pattern has no meaning floating in the middle of a chart with no context. Market structure and key price levels are the foundation that tells you whether a signal is worth acting on or ignoring entirely.
Market structure: the direction filter
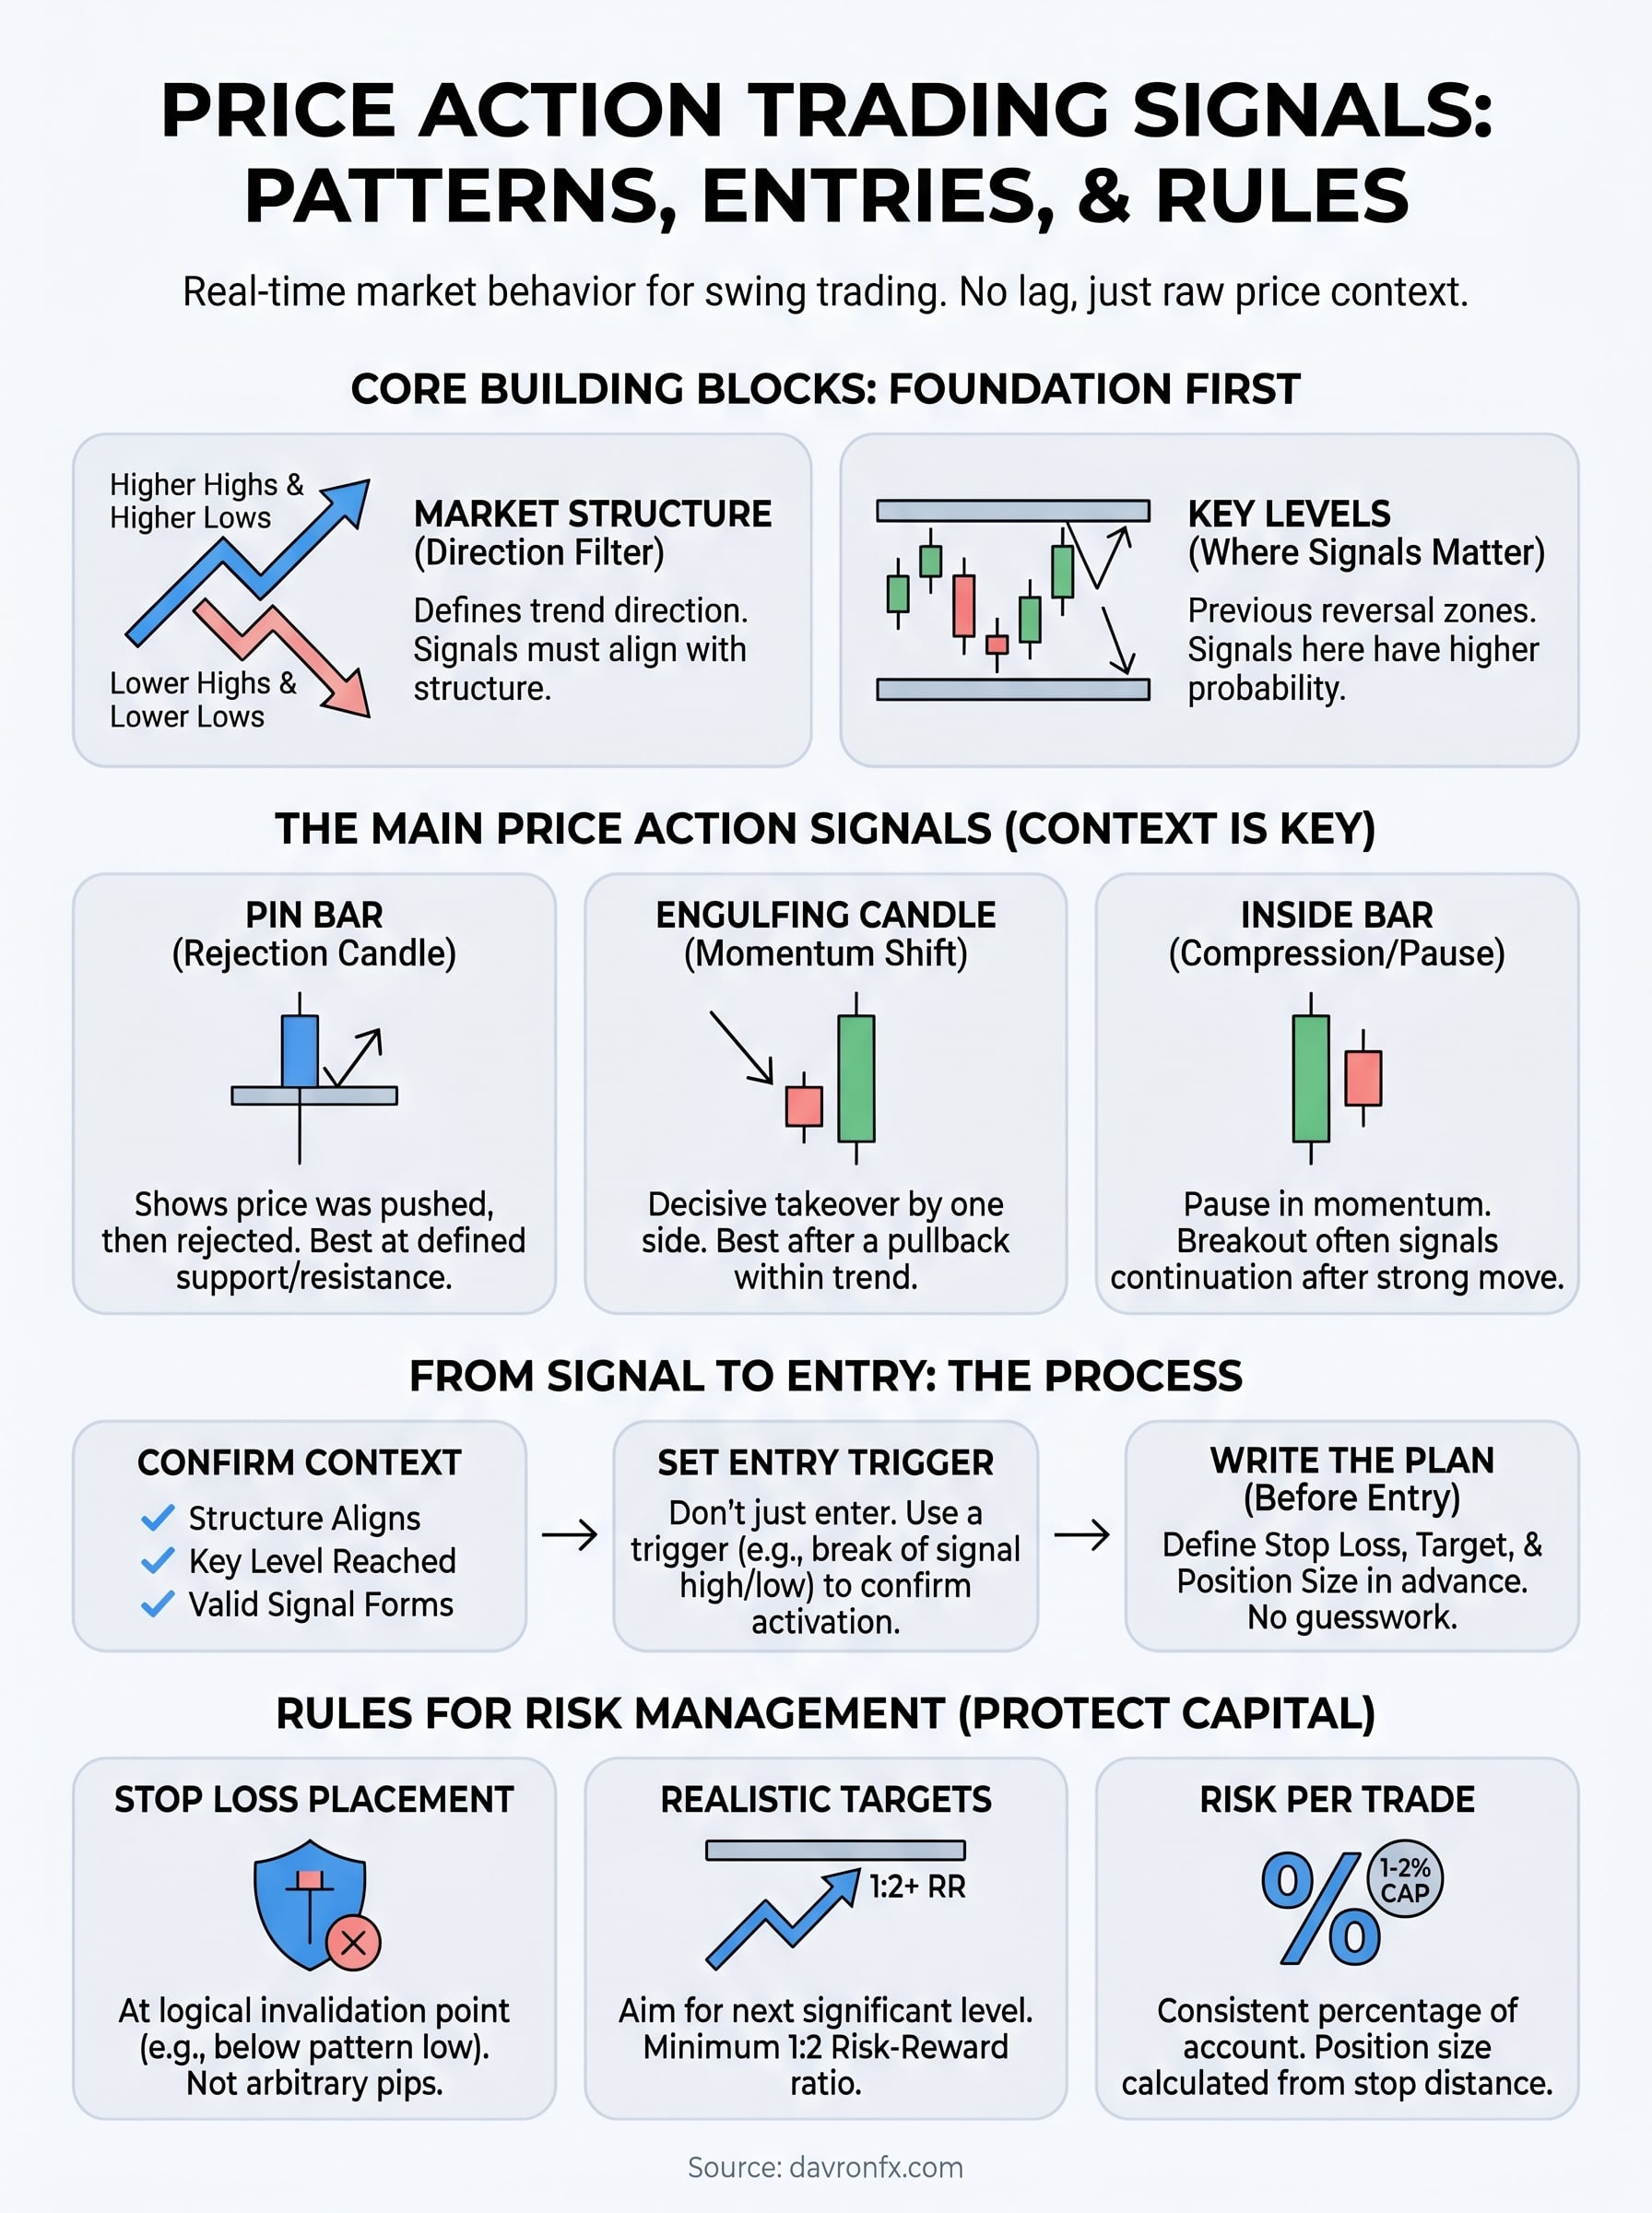
Market structure is the sequence of highs and lows that tells you which direction price is moving and whether that direction is still intact. In an uptrend, price makes a series of higher highs and higher lows. In a downtrend, it makes lower highs and lower lows. That sequence is your directional filter, and every signal you evaluate should be checked against it before you consider an entry.
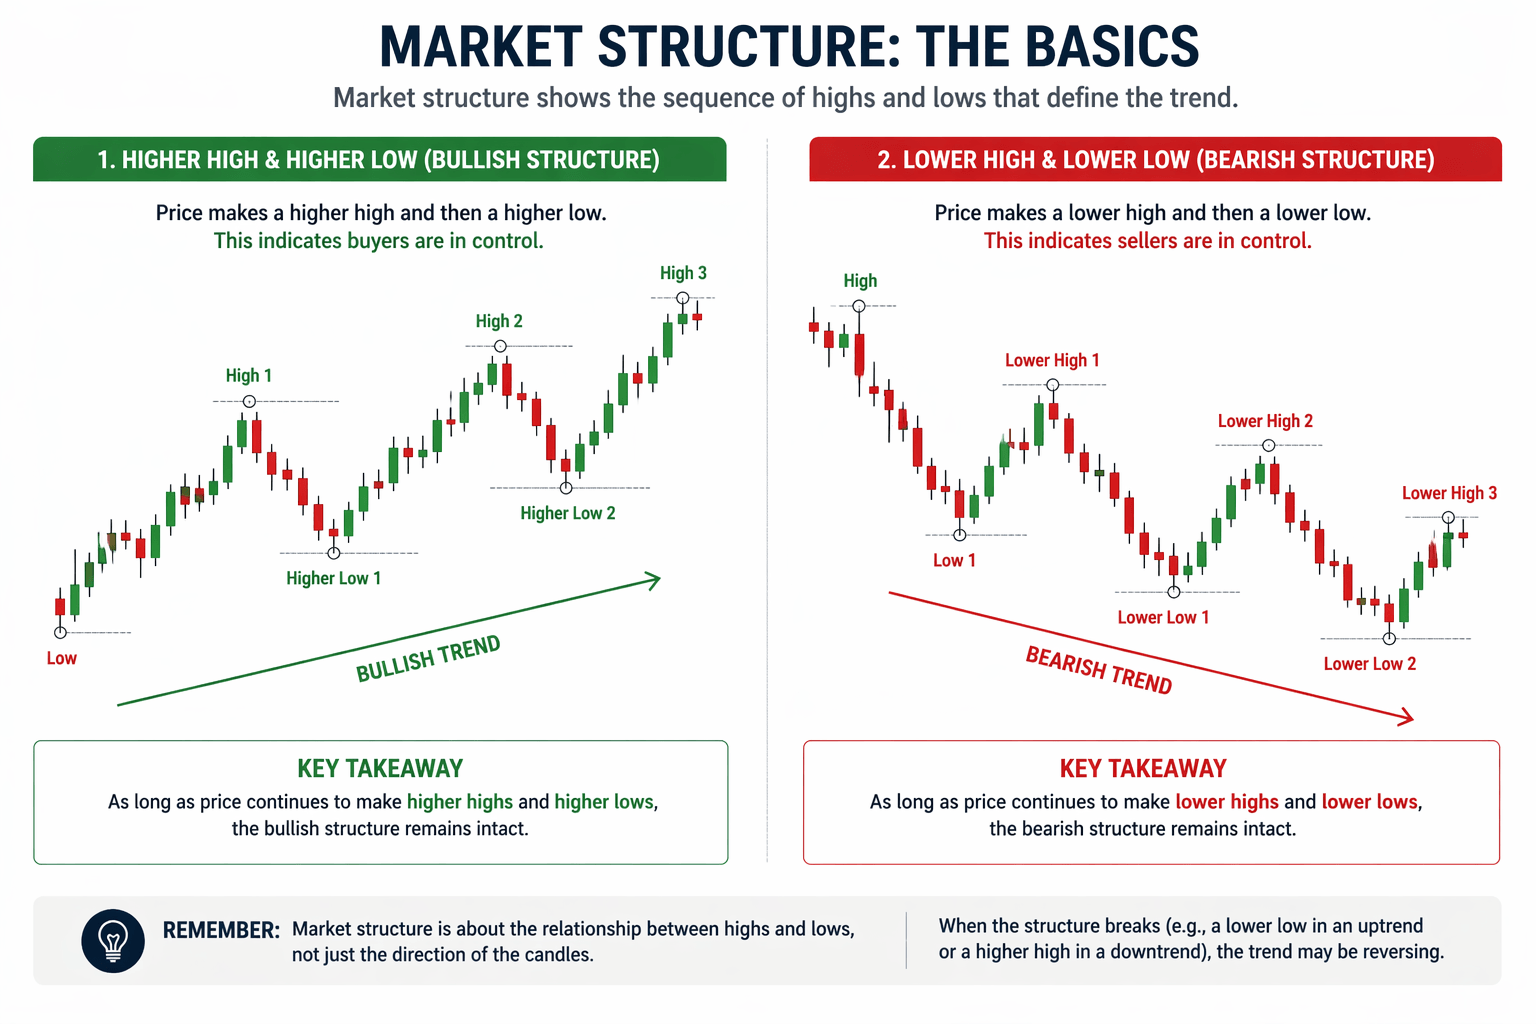
A reversal signal working against the prevailing structure has a much lower probability of producing a sustained move.
When structure is trending clearly in one direction, your best signals align with that trend. A bullish engulfing candle forming at a higher low in an uptrend is a very different setup from the same candle forming against a well-established downtrend. One is a high probability signal; the other is fighting the flow of the market. Your job as a swing trader is to stack the odds in your favor, and structure is the first layer of that process.
Key levels: where signals carry weight
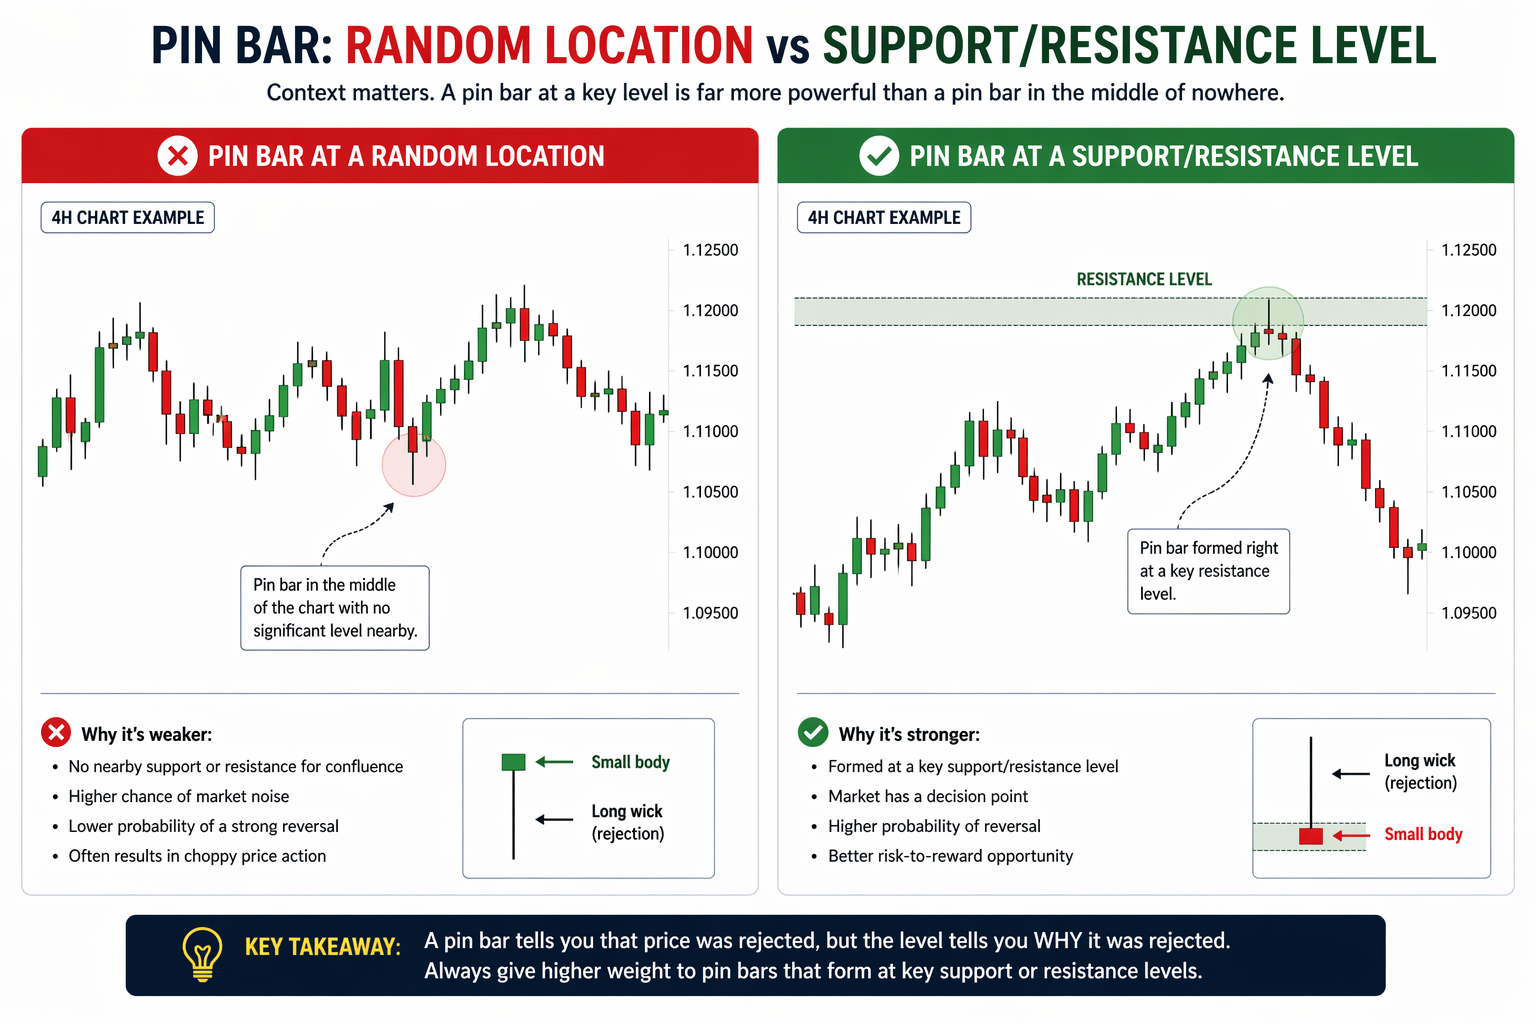
Support and resistance levels are the locations on the chart where price has previously reversed, stalled, or shown significant buying or selling activity. These levels matter because they represent price zones where large participants have taken or defended positions in the past. When price returns to those zones, the same type of activity tends to repeat, which is what gives candlestick patterns forming at those levels a reason to be trusted over patterns forming in random areas of the chart.
Identifying these levels is straightforward. Look for prior swing highs and lows, consolidation zones where price moved sideways for multiple candles, and round-number price areas that tend to attract liquidity. Structure and levels work together: structure tells you the direction, and levels tell you where to watch for a signal confirming that the direction continues. When a price action signal forms at one of these levels during a pullback in a trending structure, you have a setup that is filtered and contextually sound before you even look at the candlestick itself.
If you want to build your confidence and pattern recognition skills, take a recent chart and mark out all the swing highs and swing lows by hand. Highlight the key support and resistance zones too. This simple chart-marking exercise will help you see where major moves started and where price hesitated. The more often you do this, the quicker you’ll spot high-probability areas for signals in real time.
The main price action trading signals to know
Once structure and levels are in place, you need to know which candlestick formations qualify as actual price action trading signals worth acting on. Not every pattern carries equal weight, and the three formations below are the ones that show up consistently across swing trading setups because they each tell a clear, readable story about who is winning the battle between buyers and sellers at a given point on the chart.
Pin bars and rejection candles
A pin bar is a single candle with a small body and a long wick extending in one direction. The long wick tells you that price was pushed hard in that direction during the session, then rejected, and closed near the opposite end of the range. When that rejection happens at a key level, it signals that one side of the market stepped in with real conviction. The longer and more defined the wick relative to the body, the stronger the rejection signal.
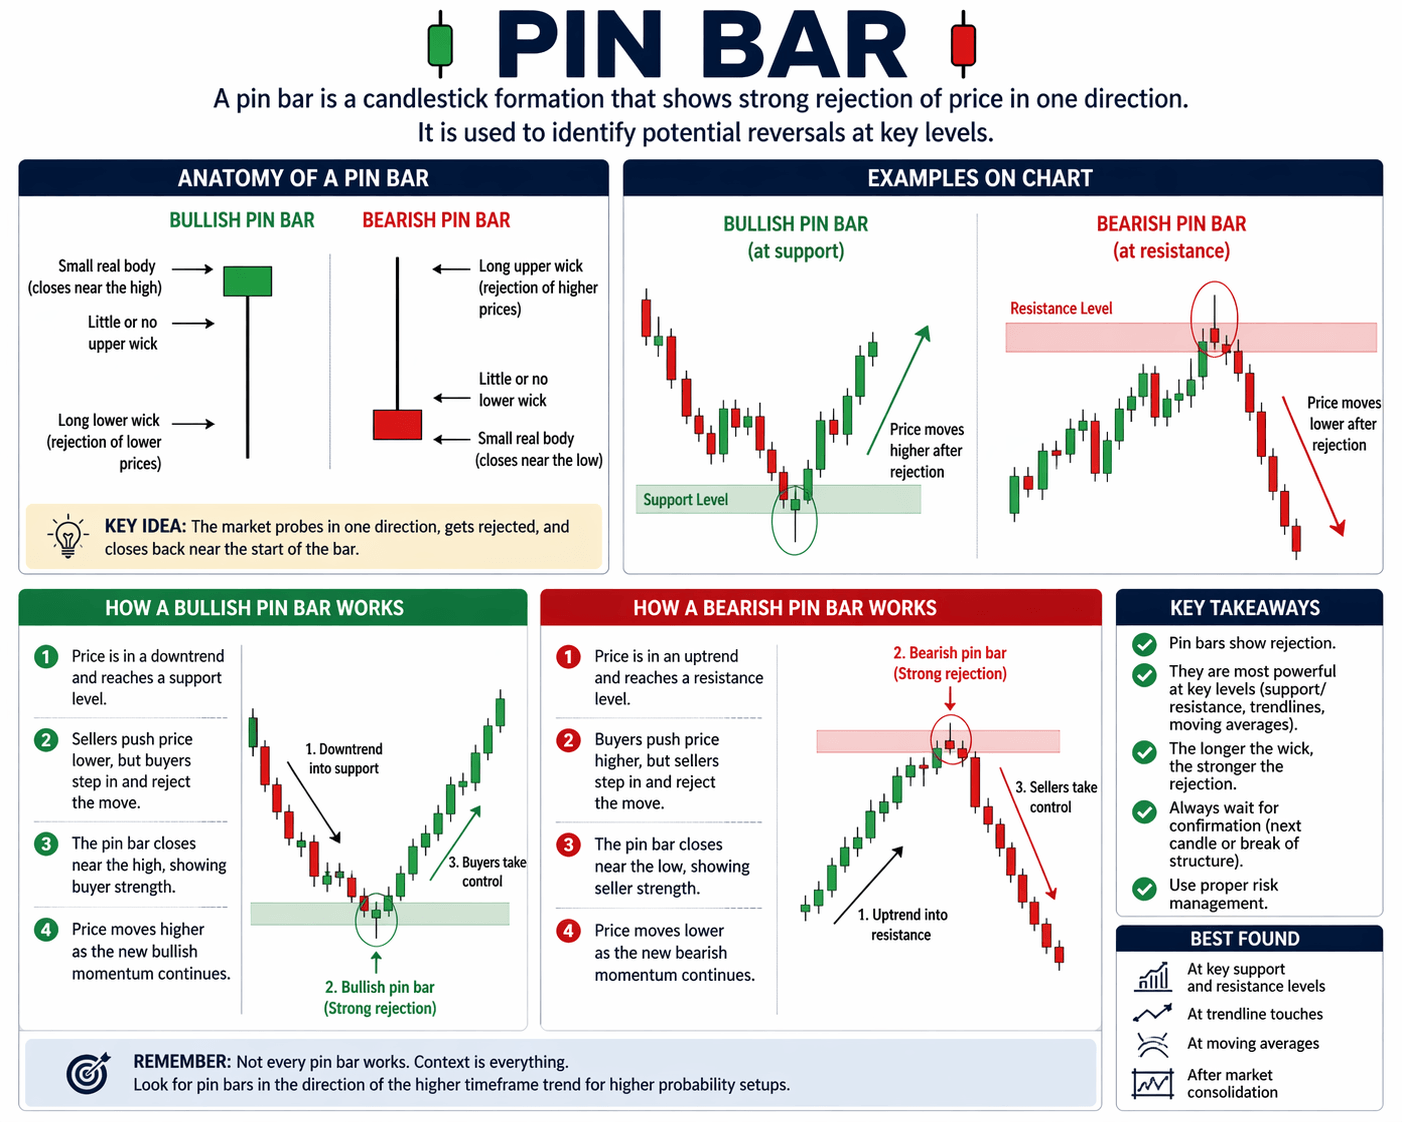
The wick is the market’s signature on the price level, showing exactly where pressure reversed.
What makes a pin bar actionable rather than just interesting is this: it must form at a level you identified before price arrived there, not after. That sequence and pre-identification are what separate a valid signal from pattern recognition after the fact.
Engulfing candles
An engulfing candle forms when a single candle’s body completely covers the body of the previous candle and closes in the opposite direction. A bullish engulfing pattern closes above the prior candle’s open; a bearish one closes below. The size of the engulfing candle relative to what it consumed tells you how decisively one side overtook the other. Larger engulfing candles with strong closes near the session high or low carry far more weight than barely-engulfing ones.
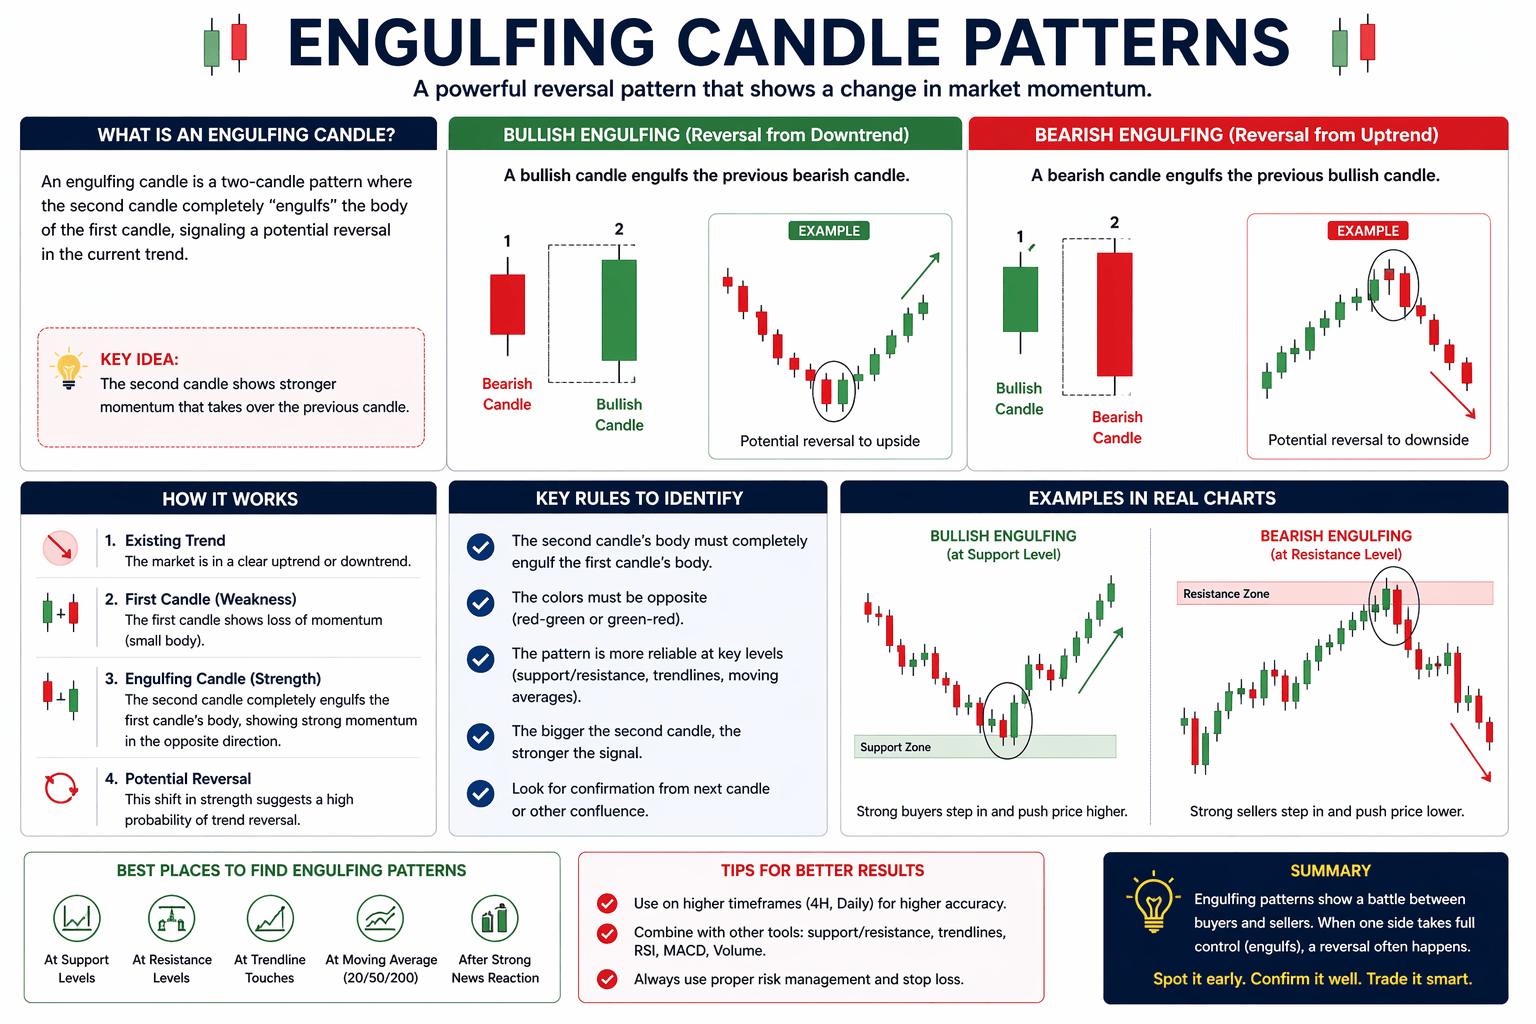
These patterns work best after a short-term pullback within a larger trend, where price has retraced to a support or resistance level. An engulfing candle forming in that context of trend and structure signals the trend is likely resuming, giving you a clean directional entry with a clear invalidation point below or above the pattern.
Inside bars
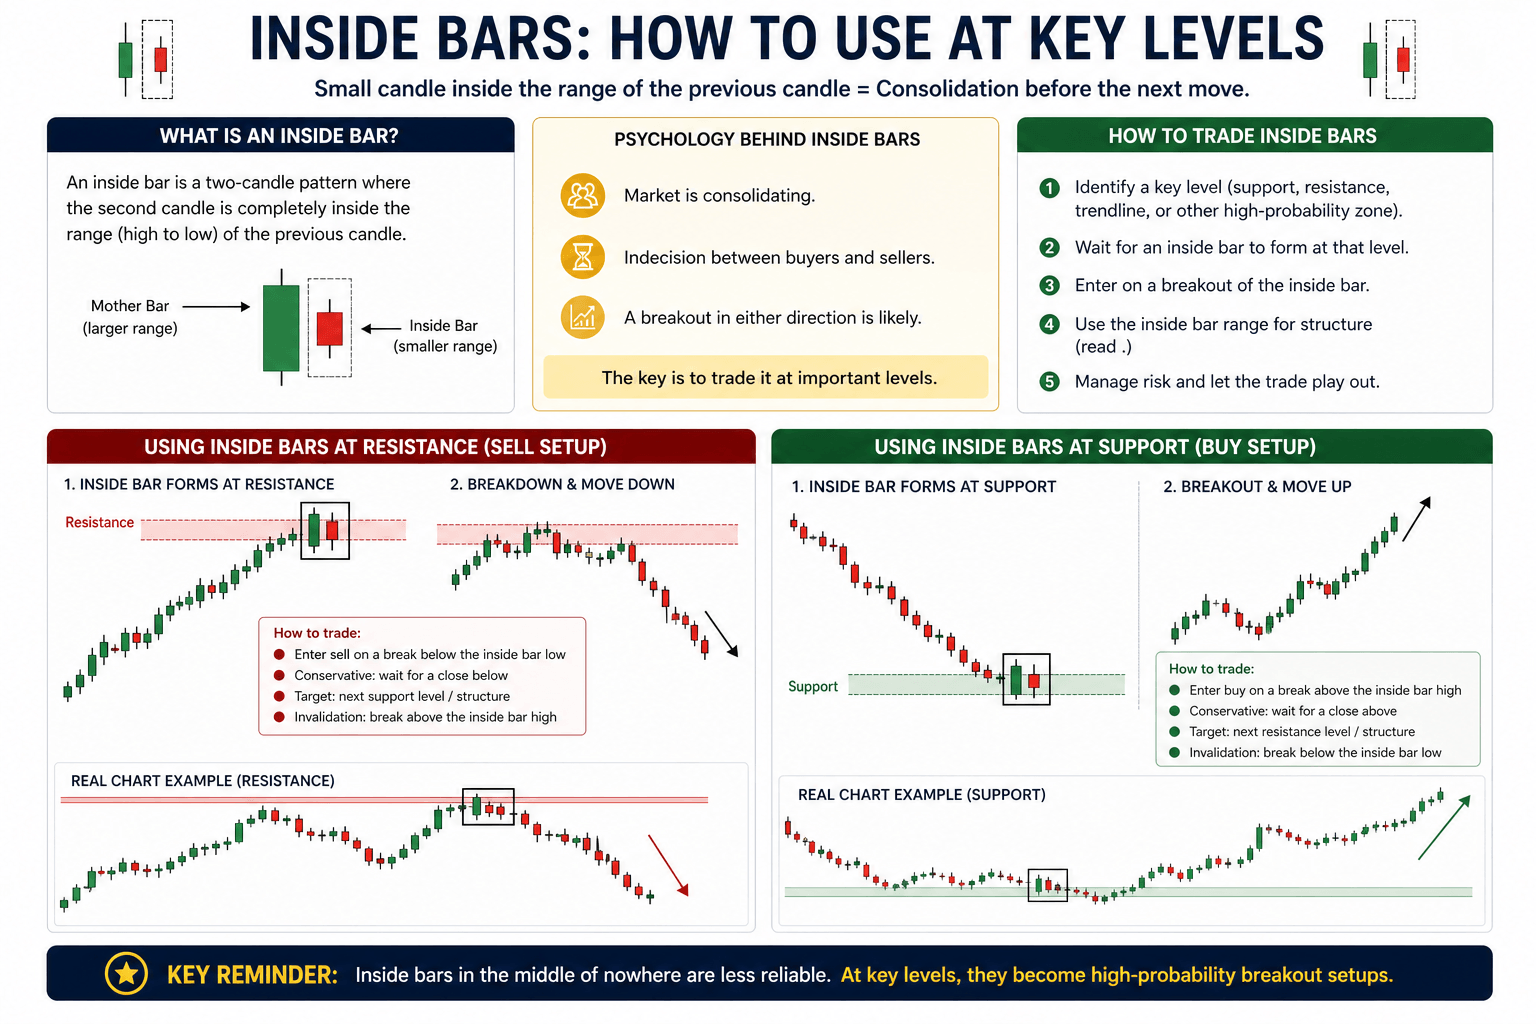
An inside bar is a candle whose high and low both sit within the range of the previous candle. It signals a pause in momentum, a compression period before the market picks a direction. When an inside bar forms directly after a strong impulsive candle, it often acts as a consolidation before continuation, and the breakout of its range in the direction of the prior impulse becomes your entry trigger.
| Signal | What it shows | Best context |
|---|---|---|
| Pin bar | Rejection of a price level | At defined support or resistance |
| Engulfing | Decisive momentum shift | Pullback to trending structure |
| Inside bar | Compression before continuation | After a strong impulsive move |
How to turn a signal into an entry and a plan
Spotting a candlestick pattern is the starting point, not the finish line. A raw signal becomes a tradeable entry only after you run it through a short checklist before placing the order. That process takes less than two minutes once you build the habit, and it separates a thought-out trade from an impulsive one that puts your capital at unnecessary risk.
Confirm the signal fits a context
Before entering, run through this quick mental checklist:
1. Is the market structure supporting my trade direction?
2. Is the signal forming at a level I identified ahead of time?
3. Does the candlestick match one of my pre-defined valid patterns?
If you check all three boxes, it’s a confirmed setup. If even one is missing, skip the trade completely. Keeping this checklist in mind helps you stay disciplined, so your signals remain reliable and consistent over time, not random.
A signal that forms outside your pre-defined criteria is not a missed opportunity. It is a bullet dodged.
Set your entry trigger
Once confirmed, you need a specific entry trigger rather than a market order on the candle close. For a pin bar or engulfing candle, a common approach is entering on a break above the high of the signal candle, with a limit order placed at that level so you are not chasing price on the next session’s open. For an inside bar, your trigger is the break of its range in your preferred direction. The entry trigger defines the exact price point that confirms the setup is activating, not just forming, which keeps you out of false starts.
Write the plan before you click a button
Your trade plan needs to exist before the order goes in, not after the price has already moved. Define the entry price, the stop location, and the first target at a minimum. Then calculate your position size based on the distance to your stop and the percentage of capital you are willing to lose if the trade fails. Every variable should be locked in before you enter, not adjusted mid-trade because the market moved in the wrong direction. Traders who skip this step end up moving stops and extending targets emotionally, which turns a well-structured setup into a decision made under pressure. Writing the plan in advance removes that pressure before it ever becomes a factor.
Here is a sample trade plan to illustrate how to put these steps into action:
Sample Trade Plan:
– Setup: Bullish pin bar at major daily support in an uptrend
– Entry: Buy at 1.2450 (break above pin bar high)
– Stop: 1.2400 (just below the pin bar wick)
– Target: 1.2600 (next key resistance)
– Risk per trade: 0.5-2% of account balance
– Position size: Calculated so that if stop is hit, only your risk for the trade is lost
Having all of this written out makes your decisions easy and removes the temptation to adjust your plan emotionally once the trade is live.
Rules for stops, targets, and risk management
A signal without a stop loss level defined from the beginning is not a trade; it is a bet. Every price action trading signal you take needs a predefined exit for both losing and winning scenarios before you place the order. Without trading rules, you are leaving your capital exposed to whatever emotional decision you make under pressure, which is never a good decision.
Where to place your stop
Your stop loss belongs at the logical invalidation point of the setup, which is the location on the chart where the signal is clearly wrong if price reaches it. For a pin bar at support, that point sits just below the tail of the wick. For an engulfing candle, it goes below the low of the entire pattern. Your stop should not be placed at a round number you feel comfortable losing, or at a fixed pip distance that has no relationship to the setup’s structure.
Placing stops at logical levels protects you from normal price movement while still exiting when the setup genuinely fails.
A common mistake is setting stops too tight to avoid a larger dollar loss. A stop that is too close gets triggered by normal volatility before the trade has a chance to work, and you end up taking losses on setups that eventually moved in the correct direction. Let the structure of the signal determine the stop, not your account balance.
How to set realistic targets
Your first target should sit at the next significant level of support or resistance in the direction of the trade. That might be a prior swing high, a major round number, or a consolidation zone where price moved sideways for an extended period. These are the locations where opposing pressure is most likely to appear, making them natural points to at least partially reduce your position and lock in profit.
Aim for a minimum risk-reward ratio of 1:2 on any swing trade, meaning your target should be at least twice the distance of your stop. If the chart does not offer that room, the setup does not qualify, regardless of how clean the signal looks.
How much to risk per trade
Cap your risk between 0.25 to 2 percent of your trading account per trade. Once you have your stop distance, calculate your position size backward from that number so the dollar amount at risk stays consistent across every trade. That consistency is what allows a profitable edge to survive the inevitable losing streaks without destroying your account before the winning trades arrive.
Next steps
You now have a complete framework for reading and acting on price action trading signals: structure, levels, pattern identification, entry rules, and risk management. Each piece builds on the last, and none of it works in isolation. The next step is to apply this consistently; a rule-based way to trade, not just understand it conceptually.
Start by identifying your key levels on the daily chart before the week opens. Then watch for any of the candlestick patterns covered here to form at either a support or a resistance level. Follow your rules consistently. Track each outcome over at least 100 trades before drawing conclusions about what is working.
If you want structured trading built on rule-based principles, with defined risk and professional analysis behind every trade, explore DavronFX’s structured swing trade signals and educational resources to see what a rule-based trading looks like in practice.